OPEN-SOURCE SCRIPT
CCT Bollinger Band Oscillator
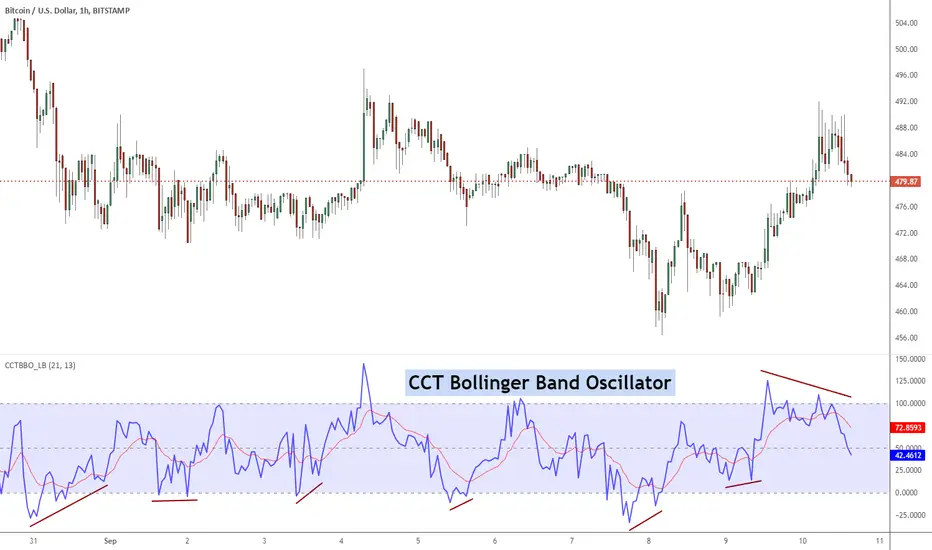
The CCT Bollinger Band Oscillator (CCTBO), developed by Steve Karnish of Cedar Creek Trading, reconfigures John Bollinger's classic Bollinger Bands (envelopes plotted at two Standard Deviations above and below a moving average) by drawing two parallel lines replacing the envelopes. The parallel lines represent a measurement of two Standard Deviations from the mean and are assigned a value of zero and 100 on the chart.
The indicator represents the price as it travels above and below the mean (50%) and outside the two standard deviations (zero and 100). Penetration of the upper band represents overbought conditions while penetration of the lower band signifies oversold conditions. Usage of the CCT Bollinger Band Oscillator to identify 'failure swings' and 'divergences' can lead to significant reversals.
List of my other indicators:
- Chart: tradingview.com/v/4IneGo8h/
- GDoc: docs.google.com/document/d/15AGCufJZ8CIUvwFJ9W-IKns88gkWOKBCvByMEvm5MLo/edit?usp=sharing
Açık kaynak kodlu komut dosyası
Gerçek TradingView ruhuyla, bu komut dosyasının mimarı, yatırımcıların işlevselliğini inceleyip doğrulayabilmesi için onu açık kaynaklı hale getirdi. Yazarı tebrik ederiz! Ücretsiz olarak kullanabilseniz de, kodu yeniden yayınlamanın Topluluk Kurallarımıza tabi olduğunu unutmayın.
List of my free indicators: bit.ly/1LQaPK8
List of my indicators at Appstore: blog.tradingview.com/?p=970
List of my indicators at Appstore: blog.tradingview.com/?p=970
Feragatname
Bilgiler ve yayınlar, TradingView tarafından sağlanan veya onaylanan finansal, yatırım, alım satım veya diğer türden tavsiye veya öneriler anlamına gelmez ve teşkil etmez. Kullanım Koşulları bölümünde daha fazlasını okuyun.