OPEN-SOURCE SCRIPT
Trident Finder
Introduction to the Trident Finder
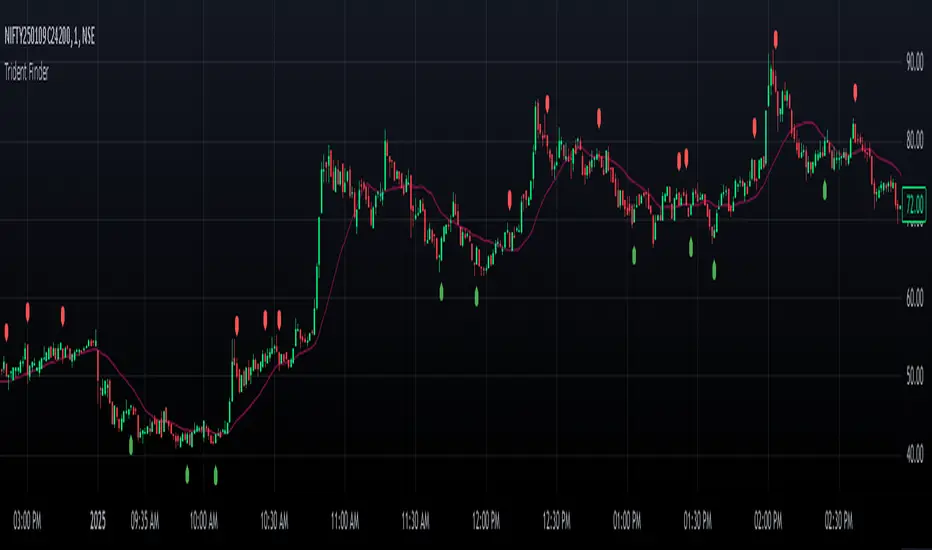
The Trident Finder is a Pine Script indicator that identifies unique bullish and bearish patterns called Tridents. These patterns are based on specific relationships between consecutive candles, combined with a simple moving average (SMA) filter for added precision. By spotting these patterns, traders can potentially identify high-probability reversal points or trend continuations.
Core Logic
The indicator identifies two patterns:
Bullish Trident
A bullish Trident forms when:
Candle[2] (two candles back) has its High-Low range entirely above Candle[1] (the preceding candle).
Candle[0] (the current candle) has its Open-High-Low-Close (OHLC) above the Low of Candle[1].
Candle[0] closes higher than it opens and higher than Candle[1]’s close.
Candle[0] closes below the SMA, indicating a potential upward breakout against the trend.
Bearish Trident
A bearish Trident forms when:
Candle[2] has its High-Low range entirely below Candle[1].
Candle[0] has its OHLC below the High of Candle[1].
Candle[0] closes lower than it opens and lower than Candle[1]’s close.
Candle[0] closes above the SMA, indicating a potential downward breakout against the trend.
Visual Representation
Bullish Tridents are marked with green "Up" labels below the candle.
Bearish Tridents are marked with red "Down" labels above the candle.
The SMA is plotted as a maroon line to serve as a filter for the Trident patterns.
Açık kaynak kodlu komut dosyası
Gerçek TradingView ruhuyla, bu komut dosyasının mimarı, yatırımcıların işlevselliğini inceleyip doğrulayabilmesi için onu açık kaynaklı hale getirdi. Yazarı tebrik ederiz! Ücretsiz olarak kullanabilseniz de, kodu yeniden yayınlamanın Topluluk Kurallarımıza tabi olduğunu unutmayın.
Feragatname
Bilgiler ve yayınlar, TradingView tarafından sağlanan veya onaylanan finansal, yatırım, alım satım veya diğer türden tavsiye veya öneriler anlamına gelmez ve teşkil etmez. Kullanım Koşulları bölümünde daha fazlasını okuyun.