PROTECTED SOURCE SCRIPT
Bimmeresty's MACD

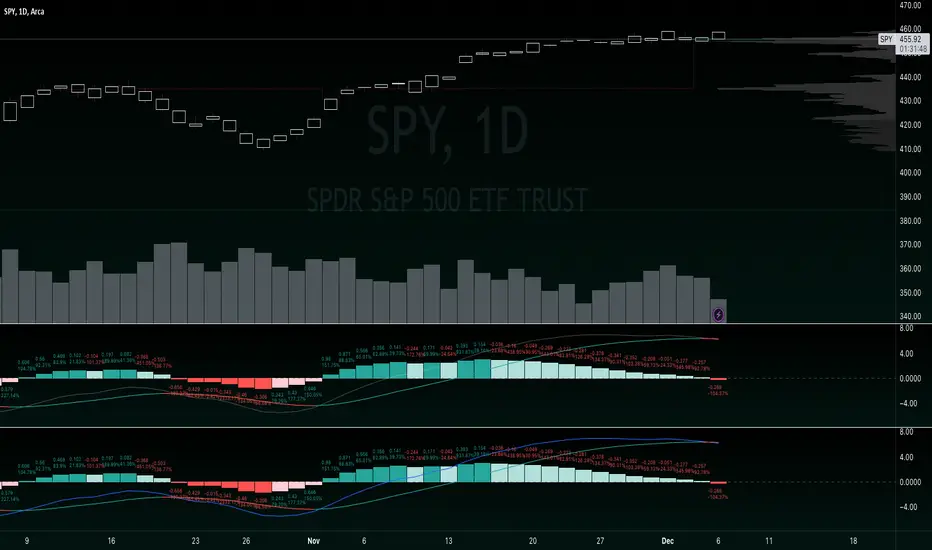
Improved MACD with labels on histogram and color change feature on signal line.
Labels on histogram help gauge how strong the change is rather than visually comparing heights.
example: "histogram just put in its first rising candle, but its only rising by 0.01 therefore i should be suspicious of it and possibly wait for a second rising candle for further confirmation of reversal"
Color change on signal slope is better for gauging the directional bias and spotting reversals.
example: "slope is red, so negative, so i should prioritize shorts"
example: "slope just turned green, so positive, so we might be reversing bias here"
Korumalı komut dosyası
Bu komut dosyası kapalı kaynak olarak yayınlanmaktadır. Ancak, ücretsiz ve herhangi bir sınırlama olmaksızın kullanabilirsiniz – daha fazla bilgiyi buradan edinebilirsiniz.
Feragatname
Bilgiler ve yayınlar, TradingView tarafından sağlanan veya onaylanan finansal, yatırım, alım satım veya diğer türden tavsiye veya öneriler anlamına gelmez ve teşkil etmez. Kullanım Koşulları bölümünde daha fazlasını okuyun.