PROTECTED SOURCE SCRIPT
ETH Growth | AlchimistOfCrypto
⚠️ DISCLAIMER: This indicator's source code is kept private as it represents a first-of-its-kind innovation in algorithmic cycle detection and visualization for Ethereum. The mathematical models and proprietary algorithms powering this indicator are the result of extensive research and development.
🌈 ETH Growth Rainbow [AlchimistOfCrypto] – Unveiling Ethereum's Logarithmic Growth Fields 🌈
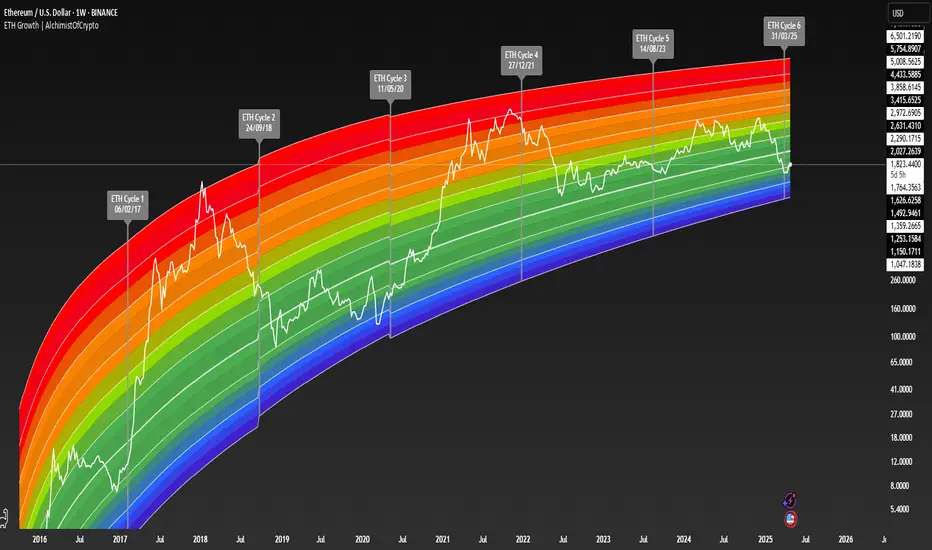
"The ETH Growth Rainbow, engineered through advanced logarithmic mathematics, visualizes the probabilistic distribution of Ethereum's price evolution within a multi-cycle growth paradigm. This indicator employs principles from logarithmic regression where coefficients p001, p002, and p003 create mathematical boundaries that define Ethereum's long-term value progression. Our implementation features algorithmically enhanced rainbow visualization derived from Fast Fourier Transform (FFT) spectral analysis, creating a dynamic representation of Ethereum's logarithmic growth with adaptive color gradients that highlight critical cycle-based phase transitions in the asset's monetary evolution."
📊 Professional Trading Application
The ETH Growth Rainbow [AlchimistOfCrypto] transcends traditional price prediction models with a sophisticated multi-band illumination system that reveals the underlying structure of Ethereum's monetary evolution. Scientifically calibrated across multiple 85-week cycles (detected through spectral analysis) and featuring seamless rainbow visualization, it enables investors to perceive Ethereum's position within its macro growth trajectory with unprecedented clarity.
- Cycle Detection Methodology 🔬
The 85-week Ethereum cycle was discovered through sophisticated Fast Fourier Transform (FFT) analysis:
- Logarithmic price returns extracted from historical Ethereum data
- FFT decomposition identifies dominant frequency components in price movements
- Signal amplitude analysis reveals the 85-week cycle as the most statistically significant periodicity
- Adaptive frequency filtering validates cycle consistency across multiple market phases
- Cycle duration rounded to nearest week for practical application
- Visual Theming 🎨
Scientifically designed rainbow gradient optimized for cycle pattern recognition:
- Violet-Blue: Lower value accumulation zones with highest mathematical growth potential
- Green: Fair value equilibrium zone representing the regression mean
- Yellow-Orange: Moderate overvaluation regions indicating potential resistance
- Red: Statistical extreme zones indicating mathematical cycle peaks
- Deep Red: New euphoria band (+6) capturing exceptional market extremes
- Cycle Visualization 🔍
- Precise cycle boundaries demarcating Ethereum's fundamental cycle events
- Adaptive band spacing based on mathematical cycle progression (p003 = 0.858)
- Multiple sub-cycle markers revealing the probabilistic nature of Ethereum's trajectory
- Initial cycle starting from 0.1639 (August 3, 2015) to preserve historical accuracy
🚀 How to Use
1. Identify Macro Position ⏰: Locate Ethereum's current price relative to regression bands
2. Understand Cycle Context 🎚️: Note position within the current 85-week cycle for time-based analysis
3. Assess Mathematical Value 🌈: Determine potential over/undervaluation based on band location
4. Adjust Investment Strategy 🔎: Modulate position sizing based on mathematical value assessment
5. Identify Cycle Phases ✅: Monitor band transitions to detect accumulation and distribution zones
6. Invest with Precision 🛡️: Utilize lower bands for strategic accumulation, upper bands for strategic reduction
7. Manage Risk Dynamically 🔐: Scale investment allocations based on mathematical cycle positioning
#ethereum #ETH #cryptocurrency #tradingview #technicalanalysis #logarithmicregression #rainbowchart #cryptotrading #tradingstrategy #priceaction #cryptoinvesting #ethanalysis #tradingbands #cryptoresearch #FFTanalysis #cyclicalanalysis #ethinvestment #ethusd #buyandsell #accumulation #macroindicator #valueanalysis #priceprediction #ethgrowth #cryptosignals #cyclicpatterns #mathematicaltrading #AI #smartmoney #cryptowhales
🌈 ETH Growth Rainbow [AlchimistOfCrypto] – Unveiling Ethereum's Logarithmic Growth Fields 🌈
"The ETH Growth Rainbow, engineered through advanced logarithmic mathematics, visualizes the probabilistic distribution of Ethereum's price evolution within a multi-cycle growth paradigm. This indicator employs principles from logarithmic regression where coefficients p001, p002, and p003 create mathematical boundaries that define Ethereum's long-term value progression. Our implementation features algorithmically enhanced rainbow visualization derived from Fast Fourier Transform (FFT) spectral analysis, creating a dynamic representation of Ethereum's logarithmic growth with adaptive color gradients that highlight critical cycle-based phase transitions in the asset's monetary evolution."
📊 Professional Trading Application
The ETH Growth Rainbow [AlchimistOfCrypto] transcends traditional price prediction models with a sophisticated multi-band illumination system that reveals the underlying structure of Ethereum's monetary evolution. Scientifically calibrated across multiple 85-week cycles (detected through spectral analysis) and featuring seamless rainbow visualization, it enables investors to perceive Ethereum's position within its macro growth trajectory with unprecedented clarity.
- Cycle Detection Methodology 🔬
The 85-week Ethereum cycle was discovered through sophisticated Fast Fourier Transform (FFT) analysis:
- Logarithmic price returns extracted from historical Ethereum data
- FFT decomposition identifies dominant frequency components in price movements
- Signal amplitude analysis reveals the 85-week cycle as the most statistically significant periodicity
- Adaptive frequency filtering validates cycle consistency across multiple market phases
- Cycle duration rounded to nearest week for practical application
- Visual Theming 🎨
Scientifically designed rainbow gradient optimized for cycle pattern recognition:
- Violet-Blue: Lower value accumulation zones with highest mathematical growth potential
- Green: Fair value equilibrium zone representing the regression mean
- Yellow-Orange: Moderate overvaluation regions indicating potential resistance
- Red: Statistical extreme zones indicating mathematical cycle peaks
- Deep Red: New euphoria band (+6) capturing exceptional market extremes
- Cycle Visualization 🔍
- Precise cycle boundaries demarcating Ethereum's fundamental cycle events
- Adaptive band spacing based on mathematical cycle progression (p003 = 0.858)
- Multiple sub-cycle markers revealing the probabilistic nature of Ethereum's trajectory
- Initial cycle starting from 0.1639 (August 3, 2015) to preserve historical accuracy
🚀 How to Use
1. Identify Macro Position ⏰: Locate Ethereum's current price relative to regression bands
2. Understand Cycle Context 🎚️: Note position within the current 85-week cycle for time-based analysis
3. Assess Mathematical Value 🌈: Determine potential over/undervaluation based on band location
4. Adjust Investment Strategy 🔎: Modulate position sizing based on mathematical value assessment
5. Identify Cycle Phases ✅: Monitor band transitions to detect accumulation and distribution zones
6. Invest with Precision 🛡️: Utilize lower bands for strategic accumulation, upper bands for strategic reduction
7. Manage Risk Dynamically 🔐: Scale investment allocations based on mathematical cycle positioning
#ethereum #ETH #cryptocurrency #tradingview #technicalanalysis #logarithmicregression #rainbowchart #cryptotrading #tradingstrategy #priceaction #cryptoinvesting #ethanalysis #tradingbands #cryptoresearch #FFTanalysis #cyclicalanalysis #ethinvestment #ethusd #buyandsell #accumulation #macroindicator #valueanalysis #priceprediction #ethgrowth #cryptosignals #cyclicpatterns #mathematicaltrading #AI #smartmoney #cryptowhales
Korumalı komut dosyası
Bu komut dosyası kapalı kaynak olarak yayınlanmaktadır. Ancak, ücretsiz ve herhangi bir sınırlama olmaksızın kullanabilirsiniz – daha fazla bilgiyi buradan edinebilirsiniz.
A lot of gifts with my links! 🎁
(Support me!)
(Support me!)
Feragatname
Bilgiler ve yayınlar, TradingView tarafından sağlanan veya onaylanan finansal, yatırım, alım satım veya diğer türden tavsiye veya öneriler anlamına gelmez ve teşkil etmez. Kullanım Koşulları bölümünde daha fazlasını okuyun.