OPEN-SOURCE SCRIPT
Güncellendi TheDevashishratio-Momentum
This custom momentum indicator is inspired by Fibonacci principles but builds a unique sequence with steps of 0.5 (i.e., 0, 0.5, 1, 1.5, 2, ...). Instead of traditional Fibonacci numbers, each step functions as a dynamic lookback period for a momentum calculation. By cycling through these fractional steps, you capture a layered view of price momentum over varying intervals.
The "Fibonacci" Series Used
Sequence:
0, 0.5, 1, 1.5, 2, … up to a user-defined maximum
For trading indicators, lag values (lookback) must be integers, so each step is rounded to the nearest integer and duplicates are removed, resulting in lookbacks:
1, 2, 3, 4, ... N
Indicator Logic
For each selected lookback, the indicator calculates momentum as:
Momentum
n
=
close
−
close
[
n
]
Momentum
n
=close−close[n]
Where:
close = current price
n = integer from your series of [1, 2, 3, ... N]
You can combine these momenta for an averaged or weighted momentum profile, displaying the composite as an oscillator.
How To Use
Bullish: Oscillator above zero indicates positive composite momentum.
Bearish: Oscillator below zero indicates negative composite momentum.
Crosses: A cross from below to above zero may signal emerging bullish momentum, and vice versa.
Customization
Adjust max_step to control how many interval lags you want in your composite.
This oscillator averages across many short and mid-term momenta, reducing noise while still being sensitive to changes.
Summary
TheDevashishratio-Momentum offers a fresh momentum oscillator, blending a "Fibonacci-like" progression with technical analysis, and can be easily copy-pasted into TradingView to experiment and refine your edge.
For more on momentum indicator logic or how to use arrays and series in Pine Script, explore TradingView's official documentation and open-source scripts
Sürüm Notları
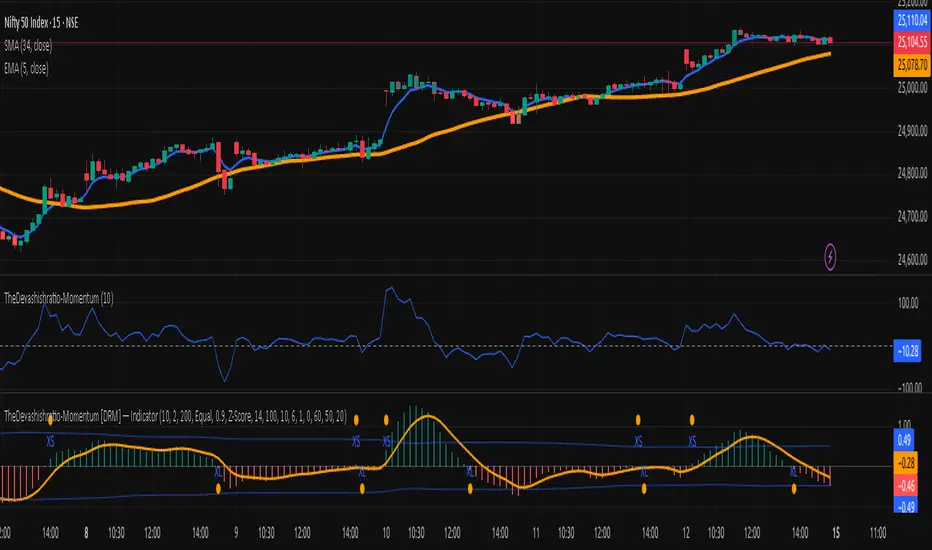
It has become more robust. TheDevashishratio-Momentum (DRM) — Multi-lookback Momentum OscillatorWhat it is.
DRM is a momentum oscillator that blends price changes across many lookbacks at once (1, 2, 3… up to a user-set cap). You can weight short lookbacks more, normalize by ATR or Z-Score to make values comparable across symbols/timeframes, smooth the result, and gate signals with higher-timeframe (HTF) trend and simple volume filters. It plots a histogram (the oscillator), a signal line, dynamic/fixed thresholds, and optional entry/exit markers. Alerts are included.
Core idea
Instead of using one period (say, 14), DRM sums ΔP = close − close[n] over a set of integer lookbacks derived from half-steps (0, 0.5, 1, 1.5… → uniques → 1, 2, 3, …).
Each ΔP can be:
Equally weighted
Linearly weighted (shorter lookbacks receive more weight)
Exponentially weighted (aggressively favors short-term momentum)
This gives a smoother, more resilient momentum read that reacts quickly without relying on a single period.
How the oscillator is built
Lookback set
Start with half-steps up to Max half-steps, convert to unique positive integers, and bound within Min / Max lookback.
Weighted momentum blend
Compute ∑ (weightᵢ × (close − close[nᵢ])) and divide by ∑ weights → mom_avg.
Normalization (optional)
None (raw points)
ATR (mom_avg ÷ ATR) for volatility scaling
Z-Score of mom_avg (rolling mean/std) for cross-asset comparability
Smoothing + Signal
EMA smoothing of the oscillator and a second EMA as the signal line.
Thresholds
Dynamic: ±k·σ using rolling stdev of the oscillator
Fixed: user-defined symmetric threshold
Plots
DRM Osc (histogram): main momentum line
Signal (line): crossovers with Osc drive setups
Zero line: mean-reversion reference
Threshold + / −: dynamic or fixed bands
Optional bar colors: teal above +threshold, red below −threshold
Optional markers: triangles for Long/Short setups, circles for suggested exits
Signals & alerts
Long setup: Osc crosses above Signal and Osc > +Threshold (+ optional filters pass)
Short setup: Osc crosses below Signal and Osc < −Threshold
Exit hints (visuals/alerts only):
Long exit when Osc crosses under 0 or an opposite Short setup appears
Short exit when Osc crosses over 0 or an opposite Long setup appears
Note: This is an indicator, not an auto-trader. Use with your own risk rules.
Filters (optional)
HTF trend filter
Pulls a higher-timeframe close and EMA (user-selectable TF and length).
Only allows Long when HTF close > HTF EMA; only Short when HTF close < HTF EMA.
Volume filter
Requires current volume > SMA(volume, lookback), avoiding thin bars.
Inputs (quick reference)
Max half-steps: defines how many half-steps generate the lookback set (larger → more periods blended).
Min/Max lookback bounds: clamps the resulting integer lookbacks.
Weighting: Equal / Linear / Exponential (with α).
Normalization: None / ATR / Z-Score (with ATR len or Z len).
Smoothing: EMA length for oscillator and for signal.
Thresholds: k·σ dynamic band or fixed value.
Filters: HTF timeframe + EMA len; Volume SMA len.
Visuals: Toggle histogram, bar color, and markers.
Recommended starting presets
General swing:
Weighting = Equal, Normalization = Z-Score (zLen 100), Smooth=10, Signal=6, Dynamic threshold ON with k=1.0.
Add HTF filter (e.g., 1H on a 5–15m chart) for higher-quality signals.
Faster intraday:
Weighting = Exponential (α≈0.85–0.92), Smooth=6–8, Signal=4–5, k=1.0–1.2.
Volume filter ON.
Trend following:
HTF filter ON (e.g., chart 15m, HTF 60m; chart 1H, HTF 4H).
Consider Fixed threshold slightly above 0 (e.g., ±0.2 ATR-norm or ±0.5 Z-Score) to avoid noise.
How to trade it (one possible workflow)
Context: Turn on the HTF filter. Trade only with the HTF direction.
Setup: Wait for Osc vs Signal crossover past the relevant threshold.
Entry: Use your own execution rule (e.g., next bar market/limit).
Risk: Place stops based on structure or ATR multiples (e.g., 1.5–2.5×ATR).
Exit:
Scale out near prior swing or when Osc crosses back to 0.
Full exit on opposite setup or when price/structure breaks.
Combine with S/R, session times, and higher-TF structure for confluence.
Strengths & caveats
Pros
Blends many lookbacks → robust momentum estimate
Normalization makes cross-asset/timeframe comparison easier
Simple, interpretable rules with clear thresholds and filters
Works for trend continuation and mean-reversion exits
Caveats
In choppy, low-vol regimes, oscillators can whipsaw. Use filters/thresholds.
Z-Score depends on window size; very small zLen can be unstable.
Dynamic thresholds expand/contract with volatility; fixed may suit some assets.
Tips
Want bar-close signals only? Wrap conditions with barstate.isconfirmed.
If the histogram feels “too hot,” increase Smooth and/or use Equal weights.
If signals are late, try Exponential weights and a shorter Signal len.
For scalping, consider Volume filter ON and slightly higher k (e.g., 1.2).
Alerts included
DRM Long Setup
DRM Short Setup
DRM Long Exit
DRM Short Exit
Configure from the chart’s Alerts menu after adding the indicator.
Credits & license
Concept and implementation: The Devashish Ratio — Momentum (DRM).
Free to use on charts; please credit if you fork or republish variations.
Açık kaynak kodlu komut dosyası
Gerçek TradingView ruhuyla, bu komut dosyasının mimarı, yatırımcıların işlevselliğini inceleyip doğrulayabilmesi için onu açık kaynaklı hale getirdi. Yazarı tebrik ederiz! Ücretsiz olarak kullanabilseniz de, kodu yeniden yayınlamanın Topluluk Kurallarımıza tabi olduğunu unutmayın.
Feragatname
Bilgiler ve yayınlar, TradingView tarafından sağlanan veya onaylanan finansal, yatırım, alım satım veya diğer türden tavsiye veya öneriler anlamına gelmez ve teşkil etmez. Kullanım Koşulları bölümünde daha fazlasını okuyun.