INVITE-ONLY SCRIPT
Volt v2
Güncellendi

Change your candle view to line or bar.
This script uses the most common strategies for the following indicators. : RSI , Moving Averages, Stochastic , ADX , MACD , VWMA , Support and Resistance , Bollinger Bands , Ichimoku Cloud , Parabolic SAR , and Commodity Channel.
It compares the default values defined by the user to the other values which are specified, determining which has been most effective over the lookback period, which also is defined by the user.
It then groups the most effective settings over the defined period for lagging and leading indicators, and issues a positive or negative score for each individual indicator.
For this iteration there are 4 leading, and 7 lagging indicators.
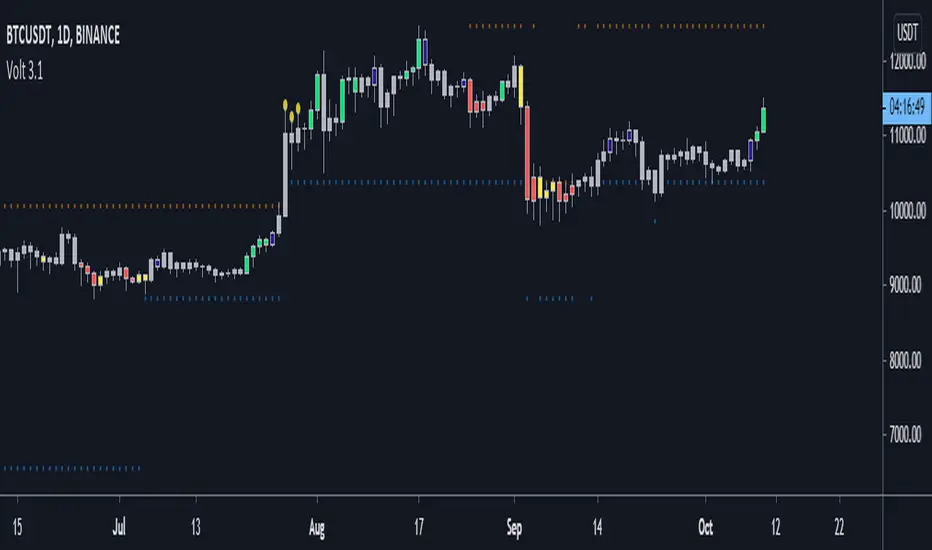
Green candles show the sum of leading, and also lagging indicator is a positive total greater than 1.
Blue shows a positive sum.
Yellow shows a negative sum.
Red shows a negative sum of leading and also lagging indicators greater than 1.
White shows no defined direction.
Trades are entered on the first red or green candle, and exited on red or yellow for longs, or green or blue for shorts.
Sürüm Notları
Added alert conditions.Long Lagging - Condition signaling lagging indicators are now positive.
Long Leading - Condition signaling leading indicators are now positive.
Short Lagging - Condition signaling lagging indicators are now negative.
Short Leading - Condition signaling leading indicators are now negative.
***Short leading is not suggested to be used on macro bullish assets.***
Exit Long - Exit Longs/Continuation of Downtrend.
Exit Short - Exit Short/Continuation of Uptrend.
Sürüm Notları
Updated logic to better define signals, and removed the ability to show individual indicators to speed up runtime. All individual indicators are available as separate indicators.Sürüm Notları
Fixed final calculation to make it more responsive, now okay to enter on blue for longs, and yellows for shorts.Sürüm Notları
Removed signals from Support/Resist, VWMA, and PSAR. Added linear extrapolation limits to all 8 of the indicators, and added Keltner Bands as the rainbow channel.
Candle colors signal green/red when giving three or more signals in the corresponding direction, which is where trades are entered, and yellow/blue when we are only getting two signals.
Trading on candles is simple, buy green, sell red.
Extrapolation limits are shown by the dots above and below the high/low; red/green dots signal two out of bounds indicators, yellow/purple signal only 1.
These require more nuance to trade, and are easily paired with the rainbow channel. If you are getting exceeds parameters dots which are inside the bands and they match, it is highly likely for a reversal to happen.
Since they are a linear extrapolation they can only describe the bounds in one direction- and will be unreliable when recovering. The easiest example of this is recovering from the coronavirus crash and other crashes in the past, it will try to sell on the way up. Do not do this- They are a linear comparison to the previous trend over 150-300 periods, and do best at describing relationship to the previous trend. Lots of high volatility in the original linear direction will THROW THEM OFF. I really cannot understate -They are for high time frame reversals - not resumptions of a trend.
EMKE Channel and Supp/Resist added for ease of use.
Yalnızca davetli komut dosyası
Bu komut dosyasına erişim, yazar tarafından yetkilendirilen kullanıcılarla sınırlıdır ve genellikle ödeme gerektirir. Sık kullanılanlarınıza ekleyebilirsiniz, ancak bunu yalnızca izin talep edip yazarından bu izni aldıktan sonra kullanabileceksiniz. Daha fazla bilgi için nonoyeslearns ile iletişime geçin veya yazarın aşağıdaki talimatlarını izleyin.
TradingView, yazarına %100 güvenmediğiniz ve komut dosyasının nasıl çalıştığını anlamadığınız sürece bir komut dosyası için ödeme yapmanızı ve onu kullanmanızı önermez. Çoğu durumda, Topluluk Komut Dosyaları bölümümüzde ücretsiz olarak iyi bir açık kaynak alternatifi bulabilirsiniz.
Yazarın talimatları
″
Bu komut dosyasını bir grafikte kullanmak ister misiniz?
Uyarı: Erişim talebinde bulunmadan önce lütfen okuyun.
Feragatname
Bilgiler ve yayınlar, TradingView tarafından sağlanan veya onaylanan finansal, yatırım, işlem veya diğer türden tavsiye veya tavsiyeler anlamına gelmez ve teşkil etmez. Kullanım Şartları'nda daha fazlasını okuyun.