INVITE-ONLY SCRIPT
BOSS Bullish/Bearish Quantitative Qualitative Estimation (QQE)
Güncellendi

THE BEST FOREX, BINARY OPTIONS, AND CRYPTO INDICATORS FOR TRADINGVIEW.COM
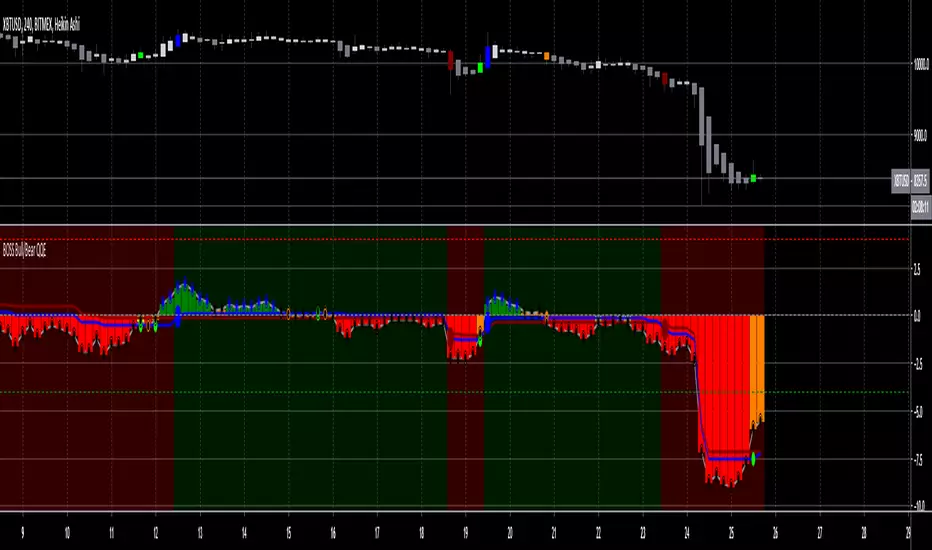
This indicator is comprised by a smoothed Relative Strength Index and two trailing levels, based on volatility – Fast Trailing Level (Fast TL – the maroon line on the chart above) and Slow Trailing Level (Slow TL – the blue line on the chart above).
The two are determined by calculating the Average True Range (ATR) of the smoothed RSI during a specified number of periods, after which a further ATR smoothing is applied with the use of an additional n-periods Wilders smoothing function.
Ultimately, the RSI’s smoothed ATR is multiplied by the Fast and Slow ATR Multipliers in order to determine the final Fast and Slow Trailing Levels.
Trading the QQE buy and sell signals:
Buy Signal
Bullish crossover happens when Fast ATR TL crosses above Slow ATR TL. When this occurs a blue circle & blue candle will appear and a alert signal to buy is generated.
Sell Signal
Bearish crossover happens when Slow ATR TL crosses above Fast ATR TL. When this occurs a maroon circle & maroon candle will appear and a alert signal to sell is generated.
Bullish/Bearish Divergence Background
Green background indicates Bullish Divergence
Red background indicates Bearish Divergence
Overbought and Oversold Conditions
An overbought condition occurs, when the QQE is at or above its 0.10 level.
An oversold condition occurs, when the QQE is at or below its -.10 level.
Sürüm Notları
RSI Buy Signal Bullish crossover happens when RSI crosses above Fast ATR TL . When this occurs a lime circle will appear and a alert signal to buy is generated.
RSI Sell Signal
Bearish crossover happens when RSI crosses below Fast ATR TL. When this occurs a orange circle will appear and a alert signal to sell is generated.
**RSI is Gray Line On Chart
Sürüm Notları
Changed Fast ATR Trailing Line Multiplier from 1.618 to 2.618Sürüm Notları
updated bar colorSürüm Notları
added candle color to correlate with bullish and bearish RSI crossoversSürüm Notları
added RSI cross candle color correlation Sürüm Notları
black fish-eye = stay in short positionblue fish-eye = stay in long position
set alerts to once per bar
at mid-line crossover you will receive two alerts this indicates time to close long or short position and open a long or short position.
Yalnızca davetli komut dosyası
Bu komut dosyasına erişim, yazar tarafından yetkilendirilen kullanıcılarla sınırlıdır ve genellikle ödeme gerektirir. Sık kullanılanlarınıza ekleyebilirsiniz, ancak bunu yalnızca izin talep edip yazarından bu izni aldıktan sonra kullanabileceksiniz. Daha fazla bilgi için TradingSafely ile iletişime geçin veya yazarın aşağıdaki talimatlarını izleyin.
TradingView, yazarına %100 güvenmediğiniz ve komut dosyasının nasıl çalıştığını anlamadığınız sürece bir komut dosyası için ödeme yapmanızı ve onu kullanmanızı önermez. Çoğu durumda, Topluluk Komut Dosyaları bölümümüzde ücretsiz olarak iyi bir açık kaynak alternatifi bulabilirsiniz.
Yazarın talimatları
″
Bu komut dosyasını bir grafikte kullanmak ister misiniz?
Uyarı: Erişim talebinde bulunmadan önce lütfen okuyun.
🚀 LinkTree: linktr.ee/TradingSafely
📊 SECTOR SPDR ETFs: tradingsafely.net/spdr
🚨 Trade Ideas: tradingsafely.net/trade-ideas/
📈 StockTwits: stocktwits.com/r/TradingSafely
📚 TV Course: bit.ly/32sLUBo
📊 SECTOR SPDR ETFs: tradingsafely.net/spdr
🚨 Trade Ideas: tradingsafely.net/trade-ideas/
📈 StockTwits: stocktwits.com/r/TradingSafely
📚 TV Course: bit.ly/32sLUBo
Feragatname
Bilgiler ve yayınlar, TradingView tarafından sağlanan veya onaylanan finansal, yatırım, işlem veya diğer türden tavsiye veya tavsiyeler anlamına gelmez ve teşkil etmez. Kullanım Şartları'nda daha fazlasını okuyun.