OPEN-SOURCE SCRIPT
Whale VWAP Heatmap

What it does
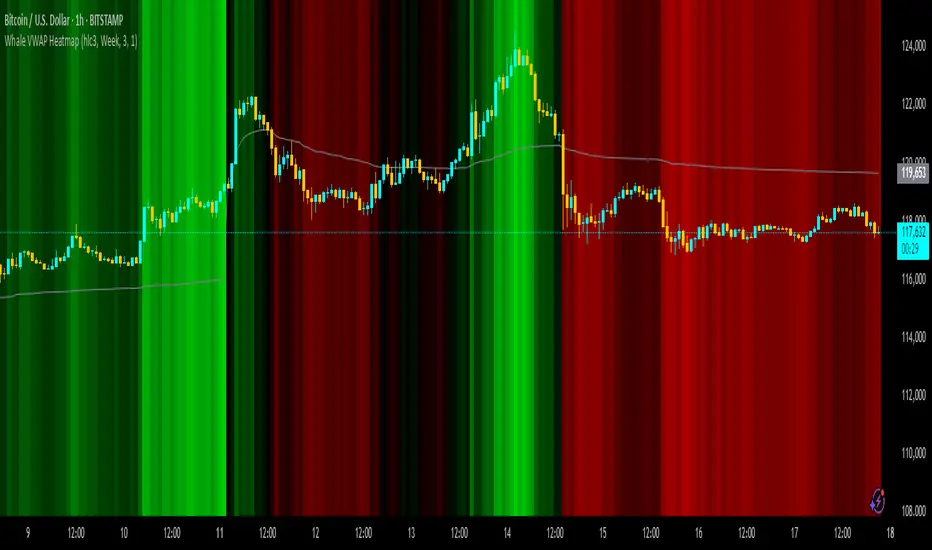
This indicator paints a heatmap around an anchored VWAP to make market context obvious at a glance.
Above VWAP → cyan background
Below VWAP → amber background
The farther price is from VWAP (in %), the stronger the color intensity.
How it works
Uses an anchored VWAP that resets on the period you choose (Session / Week / Month / Quarter / Year / Decade / Century / Earnings / Dividends / Splits).
Computes the percentage distance between price and VWAP, then maps that distance to background opacity.
Optional VWAP line can be shown/hidden.
Inputs (Settings)
Anchor Period — choose when VWAP resets (Session→Year, plus E/D/S options).
Source — price source (default hlc3).
Hide on D/W/M (Session only) — hides the script on Daily/Weekly/Monthly when anchor=Session (avoids NA behavior).
Enable Heatmap — turn background coloring on/off.
Max distance for full color (%) — at/above this % from VWAP, color hits full intensity (typical 0.5–2% depending on volatility).
Show VWAP Line / Line Color/Width — visual preference.
How to read it (quick playbook)
Context first: color tells you if price is trading above/below “fair value” (VWAP).
Intensity = how stretched price is from VWAP.
Use it to frame bias (above/below VWAP) and to avoid chasing extended moves.
Notes & limitations
Requires volume (VWAP is volume-weighted). If the data vendor doesn’t provide volume for the symbol, the script will stop.
For intraday, Session anchor is common. For swing/context, try Week or Month.
Açık kaynak kodlu komut dosyası
Gerçek TradingView ruhuyla, bu komut dosyasının mimarı, yatırımcıların işlevselliğini inceleyip doğrulayabilmesi için onu açık kaynaklı hale getirdi. Yazarı tebrik ederiz! Ücretsiz olarak kullanabilseniz de, kodu yeniden yayınlamanın Topluluk Kurallarımıza tabi olduğunu unutmayın.
Feragatname
Bilgiler ve yayınlar, TradingView tarafından sağlanan veya onaylanan finansal, yatırım, alım satım veya diğer türden tavsiye veya öneriler anlamına gelmez ve teşkil etmez. Kullanım Koşulları bölümünde daha fazlasını okuyun.