OPEN-SOURCE SCRIPT
Dynamic Ray Bands
About Dynamic Ray Bands
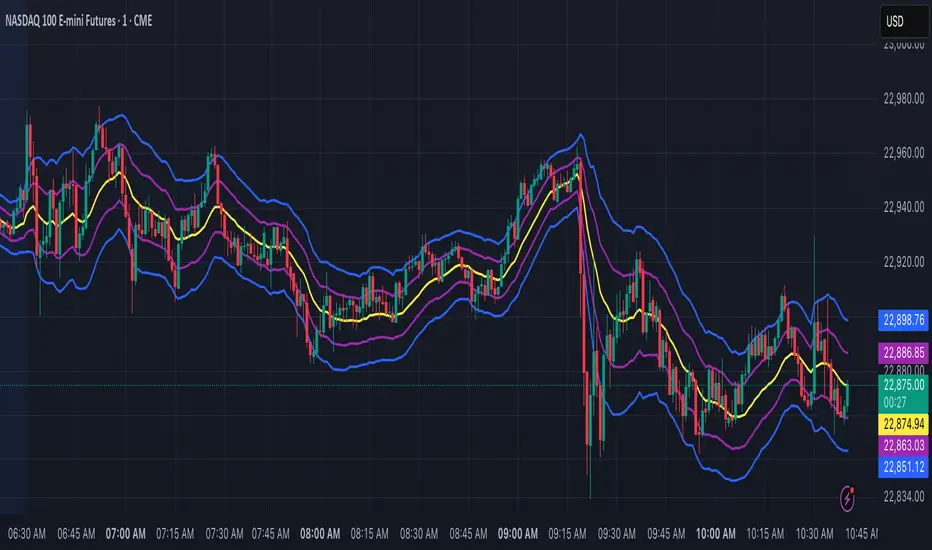
Dynamic Ray Bands is a volatility-adaptive envelope indicator that adjusts in real time to evolving market conditions. It uses a Double Exponential Moving Average (DEMA) as its central trend reference, with upper and lower bands scaled according to current volatility measured by the Average True Range (ATR).
This creates a dynamic structure that visually frames price action, helping traders identify areas of potential trend continuation, overextension, or mean reversion.
How It Works
🟡 Centerline (DEMA)
The central yellow line is a Double Exponential Moving Average, which offers a smoother, less laggy trend signal than traditional moving averages. It represents the market’s short- to medium-term “equilibrium.”
🔵 Outer Bands
Plotted at:
Upper Band = DEMA + (ATR × outerMultiplier)
Lower Band = DEMA - (ATR × outerMultiplier)
These bands define the extreme bounds of current volatility. When price breaks above or below them, it can signal strong directional momentum or overbought/oversold conditions, depending on context. They're often used as trend breakout zones or to time exits after extended runs.
🟣 Inner Bands
Plotted closer to the DEMA:
Inner Upper = DEMA + (ATR × innerMultiplier)
Inner Lower = DEMA - (ATR × innerMultiplier)
These are preliminary volatility thresholds, offering early cues for potential expansion or reversal. They may be used for scalping, tight stop zones, or pre-breakout positioning.
🔁 Dynamic Width (Bands are Dynamically Adjusted Per Tick)
The width of both inner and outer bands is based on ATR (Average True Range), which is recalculated in real time. This means:
During high volatility, the bands expand, allowing for wider price fluctuations.
During low volatility, the bands contract, tightening range expectations.
Unlike fixed-width channels or standard Bollinger Bands (which use standard deviation), this per-tick adjustment via ATR enables Dynamic Ray Bands to reduce false signals in choppy markets and remain more reactive during trending conditions.
⚙️ Inputs
DMA Length — Period for the central DEMA.
ATR Length — Lookback used for ATR volatility calculations.
Outer Band Multiplier — Controls sensitivity of extreme bands.
Inner Band Multiplier — Controls proximity of inner bands.
Show Inner Bands — Toggle for plotting the inner zone.
🔔 Alerts
Alert conditions are included for:
Price closing above/below the outer bands (trend momentum or overextension)
Price closing above/below the inner bands (early signs of strength/weakness)
🧭 Use Cases
Breakout detection — Catch price continuation beyond the outer bands.
Volatility filtering — Adjust trade logic based on band width.
Mean reversion — Monitor for snapbacks toward the DEMA after price stretches too far.
Trend guidance — Use band slope and price position to confirm direction.
⚠️ Disclaimer
This script is intended for educational and informational purposes only. It does not constitute financial advice or a recommendation to trade any specific market or security. Always test indicators thoroughly before using them in live trading.
Açık kaynak kodlu komut dosyası
Gerçek TradingView ruhuyla, bu komut dosyasının mimarı, yatırımcıların işlevselliğini inceleyip doğrulayabilmesi için onu açık kaynaklı hale getirdi. Yazarı tebrik ederiz! Ücretsiz olarak kullanabilseniz de, kodu yeniden yayınlamanın Topluluk Kurallarımıza tabi olduğunu unutmayın.
Feragatname
Bilgiler ve yayınlar, TradingView tarafından sağlanan veya onaylanan finansal, yatırım, alım satım veya diğer türden tavsiye veya öneriler anlamına gelmez ve teşkil etmez. Kullanım Koşulları bölümünde daha fazlasını okuyun.