OPEN-SOURCE SCRIPT
Güncellendi Holy Molly
Sell when the last closed candle has the purpe marking.
Buy when the last candle gets a green marking.
TP is alawys the horizontal line.
Tweak the settings for your liking, the threshold should be set always to the actual pair, to be within a few pips or points, you can get references from the chart, where you have two loes or highs really close almost with zero difference, if those are shown only, your settings is ok.
Do a back test, you will see, price eventually always gets there. Mostly the very next candle but sometimes it takes a few candles.
Sürüm Notları
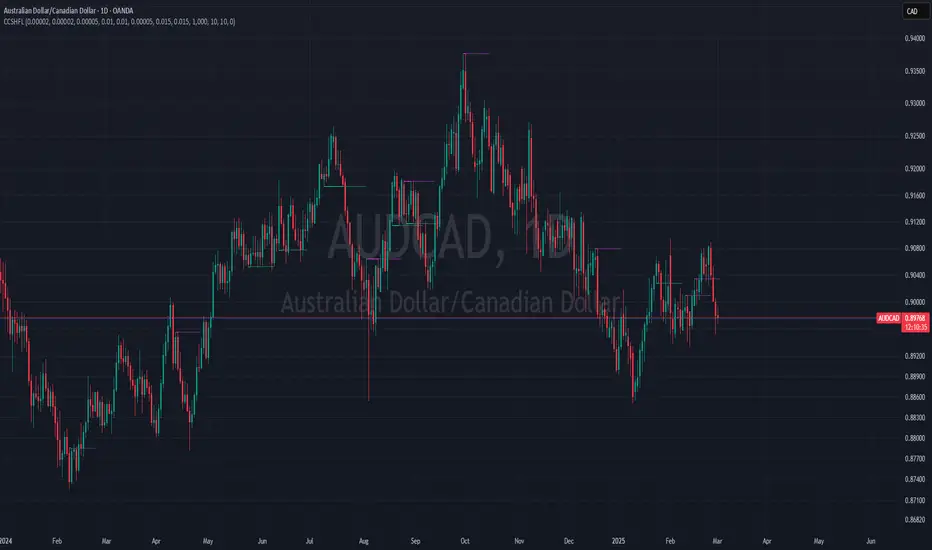
The Indicator is meant to be showing you nearly identical Highs and Lows on neiboruing candles. The logic is between the two marked candles, there can't be one that made a higher high or a lower low. The idea is to use this on a D1 or an H1 chart.
The logic is that it forms almost like a double top or double bottom. My idea of trading is that these double tops and bottoms are always breaking as there can't be a trend line drawn on them that is strong, its almsot flat out, which means that a trend change will break that flat trend, and by knowing it is flat, we can predict where that trend and eventually our price will be in the future.
So if you look at the chart, you see purple and green lines. When the indication appears, you can start aiming for that trend line to break. Green for LOWS Purple for HIHGS.
If at the candle closure, you can a marker, set your TP to that and that is. You can now review past, by changing the start candle offset, so you can back track and see that this indicator shows great accuracy. Not to mention that eventually the price always gets back to these markers, so the further away it is the better money you can make on it.
Feel free to test ti on Demo, Live trades are your responsibilty!
Açık kaynak kodlu komut dosyası
Gerçek TradingView ruhuyla, bu komut dosyasının mimarı, yatırımcıların işlevselliğini inceleyip doğrulayabilmesi için onu açık kaynaklı hale getirdi. Yazarı tebrik ederiz! Ücretsiz olarak kullanabilseniz de, kodu yeniden yayınlamanın Topluluk Kurallarımıza tabi olduğunu unutmayın.
Feragatname
Bilgiler ve yayınlar, TradingView tarafından sağlanan veya onaylanan finansal, yatırım, alım satım veya diğer türden tavsiye veya öneriler anlamına gelmez ve teşkil etmez. Kullanım Koşulları bölümünde daha fazlasını okuyun.