OPEN-SOURCE SCRIPT
Güncellendi Support and resistance zones
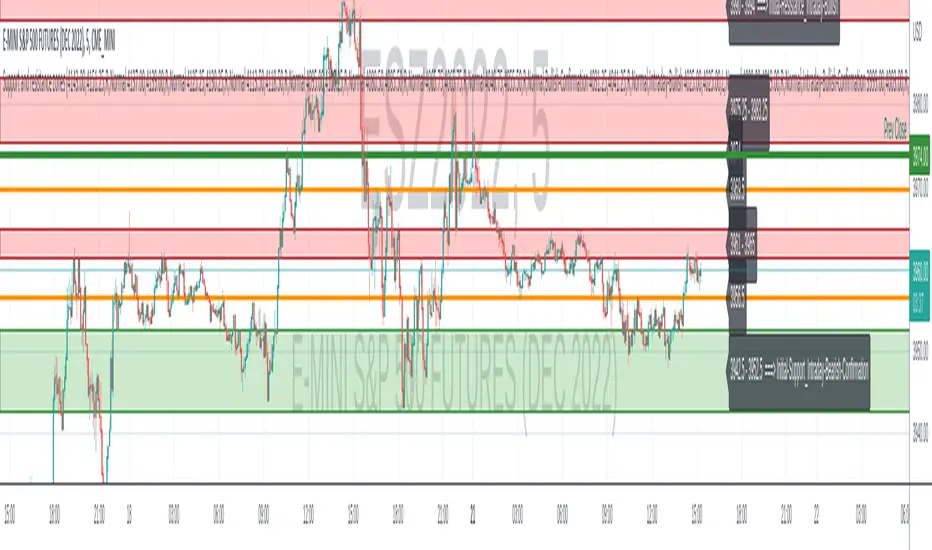
Discretionary traders often use support and resistance zones that are based on past price action of the instrument traded.
This simple script is used to plot support and resistance zones for a given instrument. The data for the zones themselves has to be determined by the past price action of the instrument and are not based on the provided data by Tradingview.
The zones input has to come as a string. Each zone consists of a string with: "<low(number)>,<high(number)>,<"S"|"R"|"L">,<"Normal"|"Strong">"" The different zone strings have to be seperated by either new line or space.
An example for the zones input looks like:
3919.25,3919.25,L,Normal
3897.50,3906.50,R,Normal
3891.00,3894.50,S,Strong
I appreciate any feedback.
Sürüm Notları
- fix the start-bar of the boxes- place labels after the last bar of the chart
Sürüm Notları
-Some more code clean-up-move start of the zone to start of the day
Sürüm Notları
Allow for optional comments in one zone string, for example "3868.00,3878.00,S,Normal,My-comment_without_space"Sürüm Notları
Fix label overlay on new bars.Sürüm Notları
Fix: move Labels on a new barSürüm Notları
Allow for zones boxes to be started some days back and not only today via input parameter.Sürüm Notları
Adjusted the labels to not be centered, but left.Açık kaynak kodlu komut dosyası
Gerçek TradingView ruhuna uygun olarak, bu komut dosyasının oluşturucusu bunu açık kaynaklı hale getirmiştir, böylece yatırımcılar betiğin işlevselliğini inceleyip doğrulayabilir. Yazara saygı! Ücretsiz olarak kullanabilirsiniz, ancak kodu yeniden yayınlamanın Site Kurallarımıza tabi olduğunu unutmayın.
Feragatname
Bilgiler ve yayınlar, TradingView tarafından sağlanan veya onaylanan finansal, yatırım, işlem veya diğer türden tavsiye veya tavsiyeler anlamına gelmez ve teşkil etmez. Kullanım Şartları'nda daha fazlasını okuyun.
Açık kaynak kodlu komut dosyası
Gerçek TradingView ruhuna uygun olarak, bu komut dosyasının oluşturucusu bunu açık kaynaklı hale getirmiştir, böylece yatırımcılar betiğin işlevselliğini inceleyip doğrulayabilir. Yazara saygı! Ücretsiz olarak kullanabilirsiniz, ancak kodu yeniden yayınlamanın Site Kurallarımıza tabi olduğunu unutmayın.
Feragatname
Bilgiler ve yayınlar, TradingView tarafından sağlanan veya onaylanan finansal, yatırım, işlem veya diğer türden tavsiye veya tavsiyeler anlamına gelmez ve teşkil etmez. Kullanım Şartları'nda daha fazlasını okuyun.