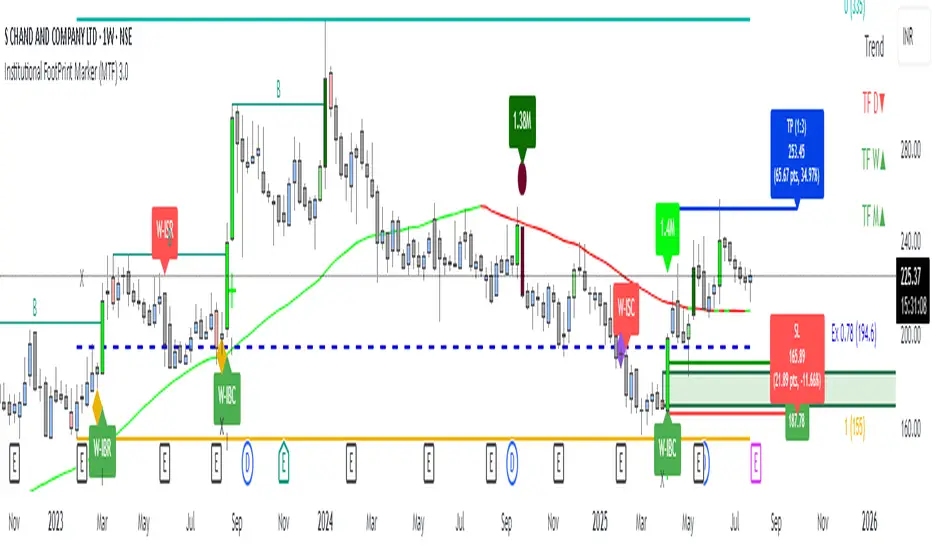
Institutional Footprint Marker (MTF) 3.0
Indicator Description & Overview
1. Understanding Institutional Buying (IB) and Institutional Selling (IS)
• Concepts:
o Institutional Buying (IB):
Large-scale buying by institutions (e.g., banks, hedge funds, proprietary firms).
Accumulates positions at discounted prices during consolidation or base zones.
Precedes a bullish impulsive move to avoid alerting retail traders.
o Institutional Selling (IS):
Institutions offload holdings at premium prices after price stability (e.g., range or base).
Followed by a bearish impulsive move as they distribute to retail buyers.
• Purpose:
o Identify smart money footprints to align trades with institutional intent.
o Detect zones where institutions accumulate (IB) or distribute (IS) for high-probability setups.
________________________________________
2. SMC + IB/IS: Use & Benefits
• Overview:
o Combines Smart Money Concepts (SMC) with IB/IS zones to track institutional activity.
o Uses SMC signals like Break of Structure (BOS), Change of Character (CHoCH), and liquidity sweeps.
• Benefits:
o Align with Smart Money: Detects institutional accumulation (IB) or distribution (IS) via structure breaks and liquidity traps.
o Refined Entries/Exits: Confirms zone validity using BOS/CHoCH for precise trade timing.
o Filters Fadeouts: Liquidity sweeps validate genuine moves, reducing false signals.
o Higher Accuracy: Combining structure shifts with zone re-entries improves trade precision.
________________________________________
3. Institutional Buying & Selling with SMC: Core Features
• Indicator Overview:
o An advanced price-action-based indicator that identifies IB/IS zones with precision.
o Integrates SMC signals, price structure shifts, and premium/discount logic.
• Key Features:
o IB/IS Zone Achievement Logic:
Tracks price reactions to confirm institutional intent.
Reduces false signals by validating zone quality.
o Auto Fibonacci Mapping:
Plots premium and discount zones based on swing structure.
Identifies optimal entry points within IB/IS zones.
o Zone Visualization:
Displays color-coded, labeled boxes for IB/IS zones.
Ensures clarity in multi-timeframe environments.
o SMC + Zone Combo:
Combines trend logic with zone re-tests for precise reversal/continuation setups.
o Smart Filter Mechanism:
Filters low-quality zones using volume, fakeouts, and structural context.
• Purpose:
o Provides a complete institutional-level toolkit for traders to align with smart money and capture high-probability opportunities.
________________________________________
4. How It Works: Zone Pattern Detection
• Patterns Tracked:
o IBC (Institutional Buy Continue):
Strong bullish impulsive move → brief consolidation → continued bullish trend.
Represents an Institutional Demand Zone.
o IBR (Institutional Buy Reversal):
Bearish move → consolidation base → sharp bullish reversal.
Represents a Reversal Demand Zone.
o ISC (Institutional Sell Continue):
Bearish impulsive move → brief consolidation → continued bearish momentum.
Represents an Institutional Supply Zone.
o ISR (Institutional Sell Reversal):
Bullish move → consolidation → strong bearish reversal.
Represents a Reversal Supply Zone.
• Detection Logic:
o Uses candle formation, strength, volume, and structure logic to identify patterns.
o Pinpoints institutional intent for continuation or reversal setups.
________________________________________
5. Detailed Features of the Indicator
5.1 Trading Mode Logic
• Modes: Manual, Aggressive, Conservative
• Functionality:
o Dynamically adjusts filters (volume multipliers, candle patterns, zone quality) based on mode.
o Conservative Mode: Stricter filters for high-probability setups.
o Aggressive Mode: Looser filters for faster entries.
o Manual Mode: Customizable settings for flexibility.
• Parameters Adjusted:
o Candle body-to-range ratio.
o Volume multipliers.
o SMA-based filters.
• Benefits:
o Eliminates manual tweaking for different trading styles (scalping, swing, investing).
o Avoids overfitting and ensures trades align with smart money interest.
5.2 Base Candle Grouping and Validation
• Feature:
o Accumulates multiple base candles (1–3 or 1–5) before an explosive move.
• Benefit:
o Confirms zone strength by ensuring zones are based on actual accumulation/consolidation, not single weak candles.
5.3 Explosive Candle & Volume Filter
• Feature:
o Identifies explosive breakout candles using:
Candle body-to-range ratio.
ATR-based size threshold.
Above-average volume.
• Benefit:
o Filters out fake breakouts and weak moves for reliable zones.
5.4 Zone Drawing Engine (HTF & LTF)
• Feature:
o Draws colored zones with:
Boxes with borders.
Extension to the right.
Adjustable marking (Wick-to-Wick or Body-to-Wick).
• Benefit:
o Provides visual clarity to spot institutional action instantly.
5.5 Multi-Timeframe Data Management
• Feature:
o Pulls OHLC and volume data from higher timeframes (HTF) and lower timeframes (LTF).
• Benefit:
o Enhances zone accuracy by aligning with broader market context.
5.6 Candle Coloring for Visual Context
• Feature:
o Colors candles based on type:
Bullish Explosive: Green.
Bearish Explosive: Red.
Boring/Base: Blue.
• Benefit:
o Offers visual cues for momentum vs. accumulation phases.
5.7 Auto Entry/SL/TP Plotting with R:R
• Feature:
o Displays:
Entry line with price.
Stop Loss (below/above zone).
Target based on Risk: Reward ratio.
o Extras:
ITM strike price calculation.
Optional % gain/loss label.
• Benefit:
o Enables instant trade planning for options, futures, or intraday setups.
5.8 Zone Achievement & Mitigation Tracking
• Feature:
o Detects price revisits or zone breaks.
o Automatically removes mitigated zones.
• Benefit:
o Keeps charts clean and prevents overtrading invalid zones.
5.9 Premium–Discount Analysis Tools
• Feature:
o Divides zone height into three bands:
Discount: Bottom (buy low).
No-trade Zone: Middle.
Premium: Top (sell high).
• Benefit:
o Refines entry selection for optimal value within zones.
5.10 Label, Border, and Style Controls
• Feature:
o Customizable options for:
Border width, box color, text size.
Toggle labels on/off.
Proximal/distal labeling.
• Benefit:
o Offers UI flexibility for professional or minimalist setups.
________________________________________
6. SMC – CHoCH and BOS Detection Module
• Purpose:
o Detects Change of Character (CHoCH) and Break of Structure (BOS) using swing highs/lows.
o Marks validated institutional demand/supply zones.
• Features:
o Swing High/Low Detection:
Identifies swing points (highest high/lowest low over past candles).
Establishes reference points for structural breaks.
o CHoCH Logic:
Bullish CHoCH: Price breaks above last swing high.
Bearish CHoCH: Price breaks below last swing low.
Signals potential market reversal.
o BOS Logic:
Bullish BOS: Price breaks previous max in an uptrend.
Bearish BOS: Price breaks previous min in a downtrend.
Validates trend continuation for trend-following entries.
o Zone Achievement Marker:
Marks validated IB/IS zones with symbols (e.g., Diamond, Circle) at the Proximal Line.
Indicates high-conviction trade levels.
• Benefits:
o Confirms institutional zones with market structure.
o Enhances trade precision with reversal/continuation signals.
________________________________________
7. Institutional Premium & Discount Detection Module
• Purpose:
o Identifies candles with significant institutional activity using volume spikes, candle body-to-range ratios, and wick analysis.
• Core Logic:
o Detects candles with:
Strong body (large close–open).
Minimal wick interference.
Volume significantly above average.
o Labels candles:
S: Significant volume spikes.
X: Extreme volume spikes.
I: Institutional footprint entries.
X (Low Volume): Volume absorption candles.
• Input Configuration:
o Candle Strength Inputs: Number of candles for volume average (default: 20).
o Volume Multipliers:
Significant: 2.5× average.
Extreme: 3.5× average.
Institutional: 3.5× average.
• Benefits:
o Highlights high-interest institutional candles.
o Differentiates regular activity from aggressive entry points.
________________________________________
8. Smart Money Concept – Structure + FVG + Premium/Discount Zones
• Integrated Features:
o Structure Break Detection (CHoCH/BOS):
Detects highs/lows using user-defined lookback.
Labels as B (Break) or C (Change) for continuation or reversal.
o Fair Value Gap (FVG) Detection:
Identifies bullish/bearish FVGs with auto-mitigation logic.
Marks inefficiency zones for potential smart money re-entries.
o Current Market Structure Display:
Draws real-time high/low structural levels for support/resistance.
o Auto Fibonacci Levels:
Plots customizable levels (e.g., 1.0, 0.78, 0.71, 0.5, 0.0).
Highlights premium (expensive) and discount (cheap) zones.
o Premium/Discount Zone Signals:
Confirms touches at key levels (e.g., 0.71) with FVG and volume validation.
Marks high-probability zones with B (Buy) or S (Sell) labels.
• Benefits:
o Combines volume, structure, and inefficiency logic for high-probability setups.
o Reduces false signals and aids in precise entry/exit planning.
________________________________________
9. Institutional Order Blocks + Fair Value Gaps (FVG)
• Input Settings:
o Toggles for plotting Order Blocks (OB), FVG, and Pivots.
o OB detection modes: Wick-to-Wick, Body-to-Wick, 1–3 candle groups.
o Customizable colors, transparency, and labels.
• OB Detection Logic:
o Bullish OB:
Strong bullish candle + valid OB structure + FVG + volume/delta confirmation.
o Bearish OB:
Same logic in bearish direction.
o OB Types:
OB+/OB-: Significant volume.
OB++/OB--: Extreme volume.
• OB Plotting & Mitigation:
o Plots zones with clear visuals.
o Recolors mitigated OBs and marks with arrows (▼ for Bull OB, ▲ for Bear OB).
• FVG Detection:
o Identifies regular and structure-breaking FVGs.
o Plots as shaded zones with borders.
• Benefits:
o Detects institutional footprints with volume-delta confluence.
o Clearly shows price inefficiencies targeted by smart money.
________________________________________
10. Inside Candle Detection
• Settings:
o Enable Inside Candle Detection: Turns on/off inside candle logic.
o Enable Bar Coloring: Highlights inside candles with a selected color.
o Bar Color: Customizes color for consolidation candles.
• Benefits:
o Visually identifies consolidation zones for breakout setups.
o Enhances clarity in spotting institutional accumulation/distribution.
________________________________________
11. Trend Meter Logic
• Purpose:
o Displays a multi-timeframe trend summary in the top-right corner with arrow symbols.
• Features:
o Enable/Disable: Toggles the trend meter panel.
o Timeframe Selection: Customizable TFs (e.g., Daily, Weekly, Monthly).
o Moving Average Logic: Uses SMA to compare price:
Price > MA → Bullish (▲ green).
Price < MA → Bearish (▼ red).
o Output Display: Table with "Trend" label in green (bullish) or red (bearish).
• Benefits:
o Compact and non-intrusive trend overview.
o Assesses trend alignment across timeframes for better trade decisions.
________________________________________
12. 3-in-1 Colored SMA/EMA
• Features:
o Visibility Controls: Toggle three MAs (short-term, mid-term, long-term).
o Color-Coding:
MA1: Blue (default).
MA2: Gray (default).
MA3: Green (rising), Red (falling).
o Crossover Markers:
MA1 crosses MA2 → Green (+) for bullish, Red (+) for bearish.
• Benefits:
o Customizable and minimalistic trend visualization.
o Highlights momentum shifts for entry/exit triggers.
________________________________________
13. Higher Timeframe Projection Candles View
• Features:
o Projects HTF candles (e.g., Weekly/Monthly) as boxes on LTF charts.
o Supports dual timeframes (e.g., 1W and 1M).
o Smart Shifting: Auto-shifts past candles for new HTF rendering.
o Table Display: Shows status/errors for invalid TF combinations.
o Location Controls: Adjusts gap between TF1 and TF2 for clarity.
• Benefits:
o Aligns micro and macro trends for institutional range analysis.
o Visualizes HTF support/resistance and liquidity zones.
________________________________________
14. No Gaps Candle (Invisible Gap Fill)
• Features:
o Detects bullish/bearish gaps (open vs. close[1]).
o Filters gaps by minimum % size (default: 3%).
o Fills gaps with transparent candles or colored boxes (Green: bullish, Red: bearish).
o Adjustable opacity and color controls.
• Benefits:
o Smooths chart visuals by filling gaps.
o Tracks liquidity voids for institutional insights.
15. Summary: Why This Indicator is Powerful (Simplified & Deepened)
The IB/IS + SMC Indicator is a game-changer for traders because it combines powerful tools to track smart money (institutional activity) and make trading decisions easier, more accurate, and adaptable to any trading style. Here’s why it stands out, explained simply and deeply:
• Multi-Timeframe Pattern Logic: Understands Institutional Moves Across Charts
o The indicator analyzes price action on multiple timeframes (e.g., 1-minute, 1-hour, daily) to spot where big players like banks and hedge funds are buying (IB) or selling (IS).
o By combining higher timeframe (HTF) context (big-picture trends) with lower timeframe (LTF) precision (entry points), it ensures you’re trading in line with the market’s true direction.
o Why It Matters: This prevents you from being tricked by short-term price noise and aligns your trades with the institutional intent, increasing your win rate.
• Auto Entry, Stop Loss, and Target Planning: Trade Without Guesswork
o The indicator automatically plots entry points, stop losses (SL), and take-profit (TP) levels based on IB/IS zones and Risk:Reward ratios.
o It also shows percentage gain/loss and calculates in-the-money (ITM) strike prices for options or futures trading.
o Why It Matters: You don’t need to manually calculate or draw levels, saving time and reducing errors. It’s like having a pro trader’s blueprint for every trade.
• Mitigation Control: Clean Charts, Focused Trading
o Once a zone is revisited or broken (mitigated), the indicator removes it from the chart to avoid clutter.
o This ensures you only focus on valid, active zones where institutions are still likely to act.
o Why It Matters: A clean chart prevents confusion and stops you from trading outdated or low-probability setups, keeping your strategy sharp.
• Mode-Based Settings: Fits Any Trading Style
o Offers three modes—Conservative, Aggressive, and Manual—to match your trading style (scalping, swing trading, or long-term investing).
o Conservative Mode: Stricter filters for high-confidence trades.
o Aggressive Mode: Faster signals for quick scalping.
o Manual Mode: Lets you customize settings for full control.
o Why It Matters: Whether you’re a fast-paced day trader or a patient investor, the indicator adapts to your needs, making it versatile and user-friendly.
• No Repainting Logic: Trustworthy Signals for Live Trading
o The indicator’s signals don’t change after they appear (no repainting), ensuring reliability in real-time trading.
o It uses real-time data like volume, candle strength, and structure to confirm signals, avoiding false or misleading setups.
o Why It Matters: You can trust the signals to make confident decisions, especially in fast-moving markets, without worrying about the indicator “cheating” by redrawing past signals.
• Combined Power of Tools: A Complete Institutional Trading Toolkit
o The indicator integrates institutional volume analysis (tracking big money moves), market structure detection (CHoCH, BOS), Fair Value Gaps (FVG) (price inefficiencies), premium/discount zones (best entry prices), and mitigation tracking (zone validity).
o Together, these tools create a holistic system that mimics how institutions trade, giving you an edge over retail traders.
o Why It Matters: Instead of juggling multiple indicators, you get one powerful tool that combines everything needed to spot high-probability trades, plan entries/exits, and stay aligned with smart money.
________________________________________
Overall Advantage (Simplified & Deep)
This indicator is like having a smart money GPS for trading. It doesn’t just show you where institutions are buying or selling—it gives you the exact tools to trade alongside them with confidence. By combining multi-timeframe analysis, automatic trade planning, clean chart management, flexible settings, and reliable signals, it simplifies complex institutional strategies into an easy-to-use, all-in-one system. Whether you’re a beginner or a pro, this indicator helps you trade smarter, avoid traps, and capture high-probability opportunities with precision.
Disclaimer:
This indicator is for informational and analytical purposes only and does not provide trade recommendations or financial advice. Trading involves significant risks, and users should conduct their own research, consider their risk tolerance, and consult a financial advisor before making trading decisions. The indicator’s signals are based on historical and real-time data, and past performance does not guarantee future results.
Yalnızca davetli komut dosyası
Bu komut dosyasına yalnızca yazar tarafından onaylanan kullanıcılar erişebilir. Kullanmak için izin istemeniz ve almanız gerekir. Bu izin genellikle ödeme yapıldıktan sonra verilir. Daha fazla ayrıntı için aşağıdaki yazarın talimatlarını izleyin veya doğrudan aquasonic1987 ile iletişime geçin.
TradingView, yazarına tam olarak güvenmediğiniz ve nasıl çalıştığını anlamadığınız sürece bir komut dosyası için ödeme yapmanızı veya kullanmanızı ÖNERMEZ. Ayrıca topluluk komut dosyaları bölümümüzde ücretsiz, açık kaynaklı alternatifler bulabilirsiniz.
Yazarın talimatları
Uyarı: Erişim talebinde bulunmadan önce lütfen yalnızca davetli komut dosyaları kılavuzumuzu okuyun.
WhatsApp. wa.me/message/RXVQD5GDOQBPJ1
Telegram: t.me/stockfusions02
Website: stockfusions.com
Email: stock.fusion02@gmail.com
Feragatname
Yalnızca davetli komut dosyası
Bu komut dosyasına yalnızca yazar tarafından onaylanan kullanıcılar erişebilir. Kullanmak için izin istemeniz ve almanız gerekir. Bu izin genellikle ödeme yapıldıktan sonra verilir. Daha fazla ayrıntı için aşağıdaki yazarın talimatlarını izleyin veya doğrudan aquasonic1987 ile iletişime geçin.
TradingView, yazarına tam olarak güvenmediğiniz ve nasıl çalıştığını anlamadığınız sürece bir komut dosyası için ödeme yapmanızı veya kullanmanızı ÖNERMEZ. Ayrıca topluluk komut dosyaları bölümümüzde ücretsiz, açık kaynaklı alternatifler bulabilirsiniz.
Yazarın talimatları
Uyarı: Erişim talebinde bulunmadan önce lütfen yalnızca davetli komut dosyaları kılavuzumuzu okuyun.
WhatsApp. wa.me/message/RXVQD5GDOQBPJ1
Telegram: t.me/stockfusions02
Website: stockfusions.com
Email: stock.fusion02@gmail.com