PROTECTED SOURCE SCRIPT
Güncellendi IBD Market School [Professional]
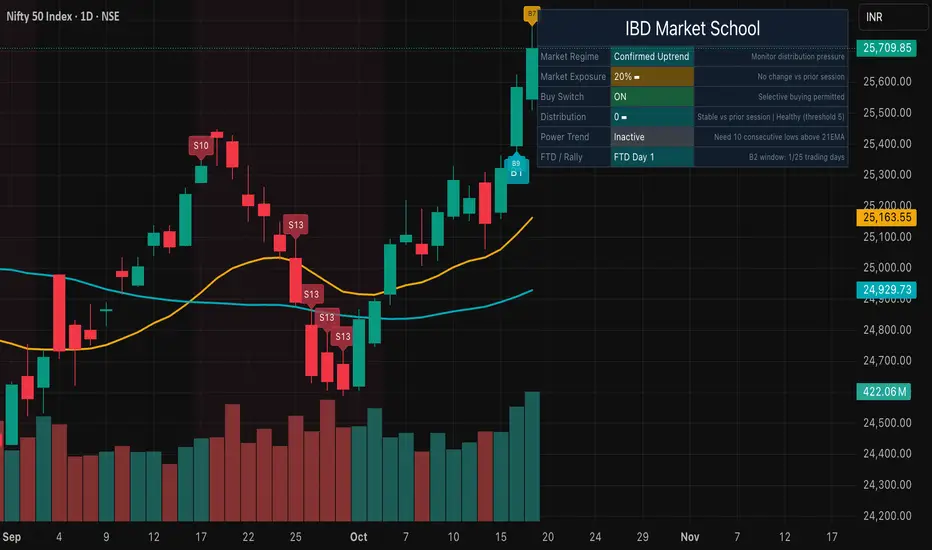
IBD Market School [Professional]
- Institutional-grade implementation of William O’Neil’s Market School timing system tuned for global and Indian benchmarks. Tracks corrections, rally attempts, follow-through days, power trends,
distribution/stalling clusters, dynamic exposure, buy switch state, and a fully themed dashboard—everything you need to keep portfolio risk aligned with Big Picture guidance.
Buy Rules
- B1 Follow-Through Day: day 4–10 of rally, gain ≥ configured %, volume > prior day.
- B2 Reinforcing FTD: second qualifying surge within 25 sessions of B1.
- B3 First Low ≥ 21 EMA after FTD.
- B4 Power Trend Start: 10 lows above 21 EMA, 21 EMA > 50 DMA (5+ days), rising 21 EMA, index within top 25% of 52-week range.
- B5 Living Above 21 EMA: every 5 additional days that the low holds the 21 EMA.
- B6 First close back above 50 DMA after confirmation.
- B7 New 52-week high in confirmed uptrend.
- B8 2× volume accumulation day with ≥1% gain.
- B9 Gap-up on above-average volume with positive close.
- B10 Accumulation day: ≥0.5% gain, 1.5× volume, close in top 20% of range.
- Additional context: ED (Expired Distribution) and 6% Rise markers track distribution clearing events.
Sell Rules
- S1 Heavy Distribution: distribution+stalling count ≥ threshold (default 5).
- S2 FTD Failure: index undercuts the Day 1 rally low post-FTD.
- S3 First break below 50 DMA after FTD.
- S4 Power trend loss: prior bar was in power trend and new close < 21 EMA.
- S5 Circuit breaker: single-day decline ≥ configured %.
- S6 Two-day cumulative decline ≥5%.
- S7 Three or more stalling days.
- S8 Volume Dry-Up: five consecutive below-average sessions with <0.5% range while confirmed.
- S9 Climax top reversal (≥3% surge with volume, then ≥1.5% drop next day).
- S10 Rally attempt exceeds FTD window (day > ftdMaxDay) without confirmation.
- S11 Distribution on an up day: small gain (<0.3%) on heavy volume closing in bottom 40% of range.
- S12 Undercut of rally Day 1 low while uptrend is confirmed.
- S13 Five straight down days.
- S14 First break below 200 DMA after confirmation.
Perfect for traders who want the full Market School cadence—rally confirmation, power-trend monitoring, distribution risk, and exposure guidance—all in one polished, fund-ready package.
Sürüm Notları
IBD Market School [Professional]- Institutional-grade implementation of William O’Neil’s Market School timing system tuned for global and Indian benchmarks. Tracks corrections, rally attempts, follow-through days, power trends,
distribution/stalling clusters, dynamic exposure, buy switch state, and a fully themed dashboard—everything you need to keep portfolio risk aligned with Big Picture guidance.
Buy Rules
- B1 Follow-Through Day: day 4–10 of rally, gain ≥ configured %, volume > prior day.
- B2 Reinforcing FTD: second qualifying surge within 25 sessions of B1.
- B3 First Low ≥ 21 EMA after FTD.
- B4 Power Trend Start: 10 lows above 21 EMA, 21 EMA > 50 DMA (5+ days), rising 21 EMA, index within top 25% of 52-week range.
- B5 Living Above 21 EMA: every 5 additional days that the low holds the 21 EMA.
- B6 First close back above 50 DMA after confirmation.
- B7 New 52-week high in confirmed uptrend.
- B8 2× volume accumulation day with ≥1% gain.
- B9 Gap-up on above-average volume with positive close.
- B10 Accumulation day: ≥0.5% gain, 1.5× volume, close in top 20% of range.
- Additional context: ED (Expired Distribution) and 6% Rise markers track distribution clearing events.
Sell Rules
- S1 Heavy Distribution: distribution+stalling count ≥ threshold (default 5).
- S2 FTD Failure: index undercuts the Day 1 rally low post-FTD.
- S3 First break below 50 DMA after FTD.
- S4 Power trend loss: prior bar was in power trend and new close < 21 EMA.
- S5 Circuit breaker: single-day decline ≥ configured %.
- S6 Two-day cumulative decline ≥5%.
- S7 Three or more stalling days.
- S8 Volume Dry-Up: five consecutive below-average sessions with <0.5% range while confirmed.
- S9 Climax top reversal (≥3% surge with volume, then ≥1.5% drop next day).
- S10 Rally attempt exceeds FTD window (day > ftdMaxDay) without confirmation.
- S11 Distribution on an up day: small gain (<0.3%) on heavy volume closing in bottom 40% of range.
- S12 Undercut of rally Day 1 low while uptrend is confirmed.
- S13 Five straight down days.
- S14 First break below 200 DMA after confirmation.
Perfect for traders who want the full Market School cadence—rally confirmation, power-trend monitoring, distribution risk, and exposure guidance—all in one polished, fund-ready package.
Korumalı komut dosyası
Bu komut dosyası kapalı kaynak olarak yayınlanmaktadır. Ancak, özgürce ve herhangi bir sınırlama olmaksızın kullanabilirsiniz – daha fazla bilgi burada.
Feragatname
Bilgiler ve yayınlar, TradingView tarafından sağlanan veya onaylanan finansal, yatırım, işlem veya diğer türden tavsiye veya tavsiyeler anlamına gelmez ve teşkil etmez. Kullanım Şartları'nda daha fazlasını okuyun.