OPEN-SOURCE SCRIPT
Güncellendi ICT Friday's Asian Range°
This concept was engineered and taught by the Inner Circle Trader.
The goal of this script is to outline a potential draw on liquidity for the next trading week. It gives a parameter for ICT PD Arrays to be located above and below the marketplace and should be used in conjunction with the higher Timeframe Arrays as defined by ICT.
If there is a higher Timeframe array with a standard deviation confluence of the Friday Asian Range it is considered high probability for price to reach up/down to that level, and present a potential retracement or reversal.
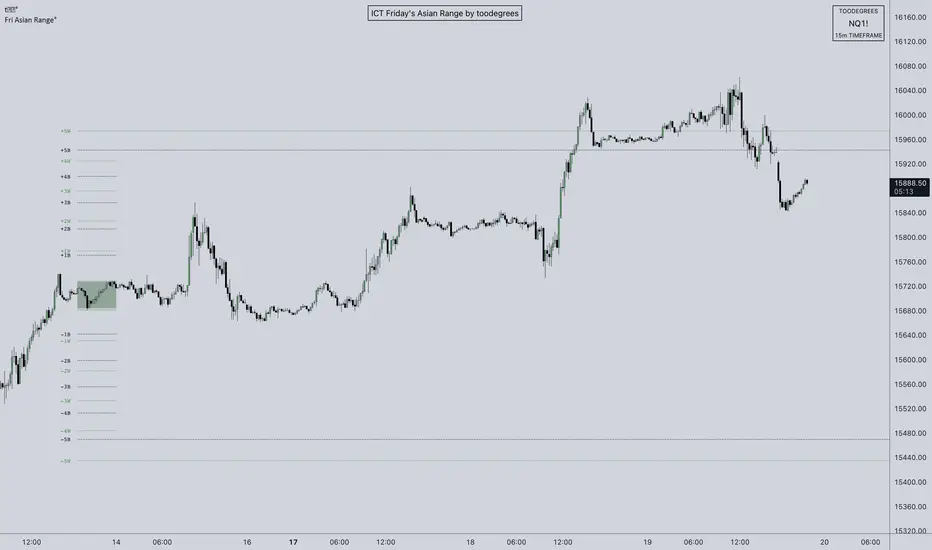
The Asian Range is defined as the window of Time between 7PM to Midnight New York Time. In this case we will be only using the Friday's Asian Range which will take place on Thursday between these Times.
We have two ranges: a Body range made of the highest and lowest candle bodies, and a Wick range made by the highest and lowest candle wicks.
ICT teaches that we only want to apply this concept to the 5minute and 15minute chart.
THIS SCRIPT WILL NOT WORK ON ANY OTHER TIMEFRAME OUT OF THE BOX
Framework:

Visualization:

Example:
https://www.tradingview.com/x/YRDTcQJj/
The goal of this script is to outline a potential draw on liquidity for the next trading week. It gives a parameter for ICT PD Arrays to be located above and below the marketplace and should be used in conjunction with the higher Timeframe Arrays as defined by ICT.
If there is a higher Timeframe array with a standard deviation confluence of the Friday Asian Range it is considered high probability for price to reach up/down to that level, and present a potential retracement or reversal.
The Asian Range is defined as the window of Time between 7PM to Midnight New York Time. In this case we will be only using the Friday's Asian Range which will take place on Thursday between these Times.
We have two ranges: a Body range made of the highest and lowest candle bodies, and a Wick range made by the highest and lowest candle wicks.
ICT teaches that we only want to apply this concept to the 5minute and 15minute chart.
THIS SCRIPT WILL NOT WORK ON ANY OTHER TIMEFRAME OUT OF THE BOX
Framework:
Visualization:
Example:
https://www.tradingview.com/x/YRDTcQJj/
Sürüm Notları
Minor Code Clean UpSürüm Notları
Bug Fix: alert trigger bug where some stdevs were not triggering fixedAçık kaynak kodlu komut dosyası
Gerçek TradingView ruhuyla, bu komut dosyasının mimarı, yatırımcıların işlevselliğini inceleyip doğrulayabilmesi için onu açık kaynaklı hale getirdi. Yazarı tebrik ederiz! Ücretsiz olarak kullanabilseniz de, kodu yeniden yayınlamanın Topluluk Kurallarımıza tabi olduğunu unutmayın.
homo faber fortunæ suæ
Feragatname
Bilgiler ve yayınlar, TradingView tarafından sağlanan veya onaylanan finansal, yatırım, alım satım veya diğer türden tavsiye veya öneriler anlamına gelmez ve teşkil etmez. Kullanım Koşulları bölümünde daha fazlasını okuyun.
Açık kaynak kodlu komut dosyası
Gerçek TradingView ruhuyla, bu komut dosyasının mimarı, yatırımcıların işlevselliğini inceleyip doğrulayabilmesi için onu açık kaynaklı hale getirdi. Yazarı tebrik ederiz! Ücretsiz olarak kullanabilseniz de, kodu yeniden yayınlamanın Topluluk Kurallarımıza tabi olduğunu unutmayın.
homo faber fortunæ suæ
Feragatname
Bilgiler ve yayınlar, TradingView tarafından sağlanan veya onaylanan finansal, yatırım, alım satım veya diğer türden tavsiye veya öneriler anlamına gelmez ve teşkil etmez. Kullanım Koşulları bölümünde daha fazlasını okuyun.