OPEN-SOURCE SCRIPT
SPY Ninja
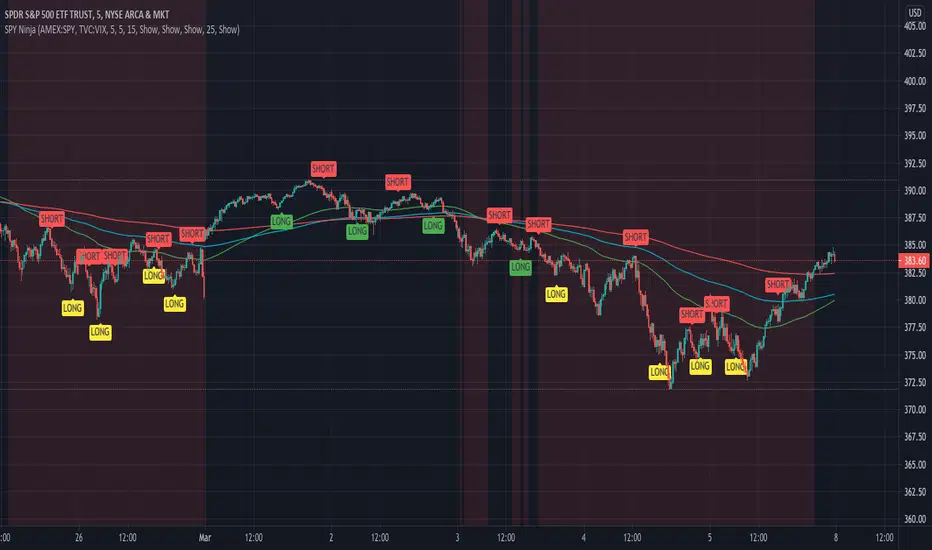
SPY Ninja correlates the true strength index exponential moving averages of SPY and VIX together. In doing so we can determine the start of trend shifts via SPY / VIX convergence in addition to crossover, with potential market entries and exits represented by the LONG and SELL signals.
SMMA 50,100, and 200 have been added to chart due to the historic SPY market reactivity to these moving averages. They often act as natural support and resistance levels with SPY, and when coinciding LONG and SHORT signals appear touching any of these levels, it adds an extra layer of confidence for traders' decisions. Also, by highlighting the areas on our SPY chart (red background areas) that represent a VIX threshold higher than 25, we can bring attention to areas with potentially higher volatility immediately so that traders know to proceed with caution.
SPY Ninja works harmoniously with the SPY Ninja Oscillator; Ninja provides the signals highlighting risky VIX areas of concern, while the Ninja Oscillator adds an additional 3 levels of potential confirmation for your trade decisions.
Açık kaynak kodlu komut dosyası
Gerçek TradingView ruhuyla, bu komut dosyasının mimarı, yatırımcıların işlevselliğini inceleyip doğrulayabilmesi için onu açık kaynaklı hale getirdi. Yazarı tebrik ederiz! Ücretsiz olarak kullanabilseniz de, kodu yeniden yayınlamanın Topluluk Kurallarımıza tabi olduğunu unutmayın.
Feragatname
Bilgiler ve yayınlar, TradingView tarafından sağlanan veya onaylanan finansal, yatırım, alım satım veya diğer türden tavsiye veya öneriler anlamına gelmez ve teşkil etmez. Kullanım Koşulları bölümünde daha fazlasını okuyun.