SKYNET buy/sell 2.0
**Anchor line : This anchor line is calculated based on certain parameters.
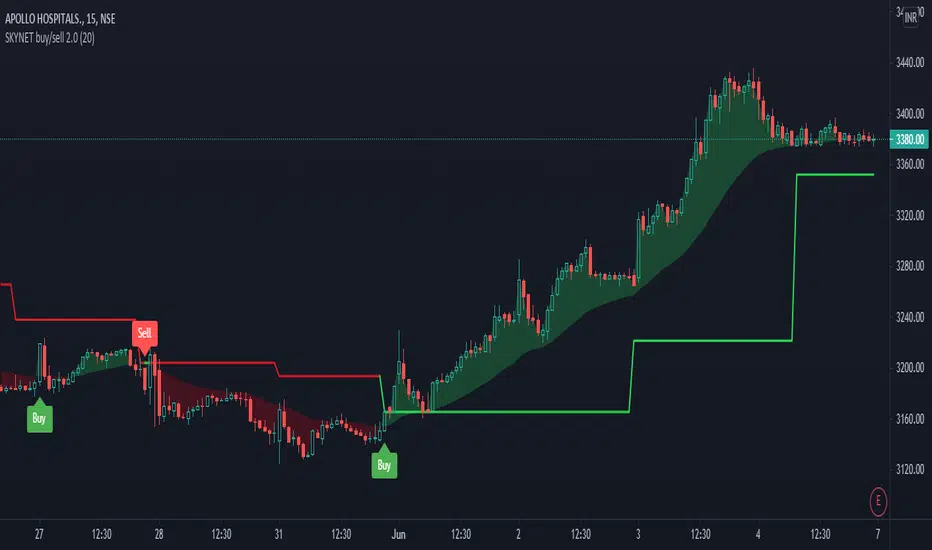
The anchor line is calculated in such a way that the stock/instrument moves around this anchor line.
The calculation of the anchor line uses a look back period which is set to 9 by default. The user can go to the indicator settings and change it to suit their trading style.
Note:
1) As the look back period increases, the number of signals generated on the chart decreases.
2) This indicator will only work on charts/stocks/instruments which are actually traded in the market i.e actual contracts of the stock/instrument is traded in the market. Hence, it will not work on indexes.
BUY signal: When the stock/instrument deviates to the upside of the anchor line by a specific margin, the Buy signal is generated.
SELL signal: When the stock/instrument deviates to the downside of the anchor line by a specific margin, the Sell signal is generated.
Disclaimer: This indicator is not 100% accurate and false signals are generated from time to time. Trading in the markets involves huge risks and one should always do his/her own research before making any trading decisions. This indicator is only designed to help you make a trading decision.
++ A time constraint has been added. The indicator script now runs between
9:30 to 1500.
The VISUAL TREND is established by using a couple of exponential moving averages with customized parameters and settings.
A buy signal is more likely to work if the VISUAL TREND is bullish.
A sell signal is more likely to work if the VISUAL TREND is bearish.
++ Time constraint has been removed to increase the efficiency of the indicator on cryptocurrency charts.
https://www.tradingview.com/x/l6SzG0sB/
Yalnızca davetli komut dosyası
Bu komut dosyasına yalnızca yazar tarafından onaylanan kullanıcılar erişebilir. Kullanmak için izin istemeniz ve almanız gerekir. Bu genellikle ödeme yapıldıktan sonra verilir. Daha fazla ayrıntı için aşağıdaki yazarın talimatlarını izleyin veya doğrudan skynet970 ile iletişime geçin.
TradingView, yazarına tamamen güvenmediğiniz ve nasıl çalıştığını anlamadığınız sürece bir komut dosyası için ödeme yapmanızı veya kullanmanızı TAVSİYE ETMEZ. Ayrıca topluluk komut dosyalarımızda ücretsiz, açık kaynaklı alternatifler bulabilirsiniz.
Yazarın talimatları
Feragatname
Yalnızca davetli komut dosyası
Bu komut dosyasına yalnızca yazar tarafından onaylanan kullanıcılar erişebilir. Kullanmak için izin istemeniz ve almanız gerekir. Bu genellikle ödeme yapıldıktan sonra verilir. Daha fazla ayrıntı için aşağıdaki yazarın talimatlarını izleyin veya doğrudan skynet970 ile iletişime geçin.
TradingView, yazarına tamamen güvenmediğiniz ve nasıl çalıştığını anlamadığınız sürece bir komut dosyası için ödeme yapmanızı veya kullanmanızı TAVSİYE ETMEZ. Ayrıca topluluk komut dosyalarımızda ücretsiz, açık kaynaklı alternatifler bulabilirsiniz.