OPEN-SOURCE SCRIPT
Madrid Donchian SEC bar

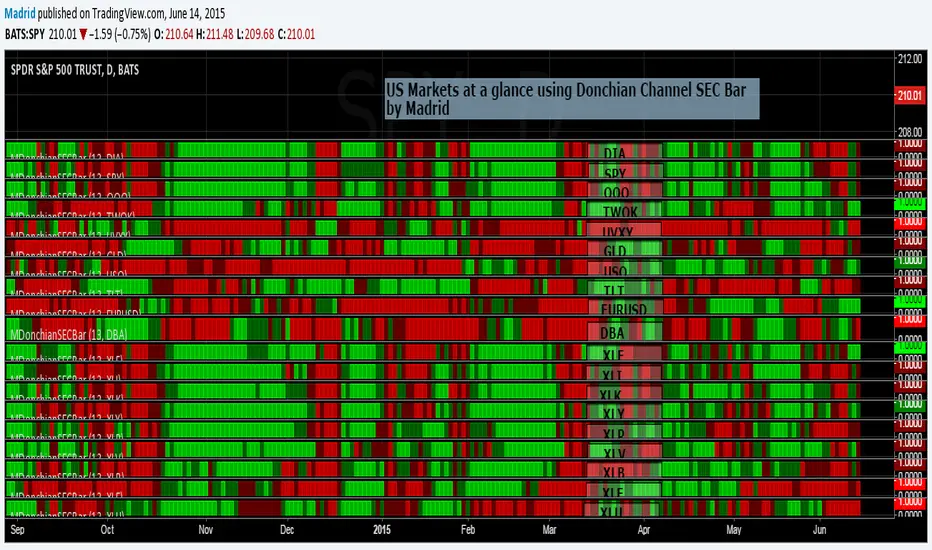
This study is based on the Donchain Channel Bar indicator but this adds security as a parameter. This allows several instances of this indicator to be used in the same page to create a heat map to take look at a glance at several securities, just like the example where this was implemented.
The only two parameters it requires are the security symbol and the length of the analysis.
The only two parameters it requires are the security symbol and the length of the analysis.
Açık kaynak kodlu komut dosyası
Gerçek TradingView ruhuna uygun olarak, bu komut dosyasının oluşturucusu bunu açık kaynaklı hale getirmiştir, böylece yatırımcılar betiğin işlevselliğini inceleyip doğrulayabilir. Yazara saygı! Ücretsiz olarak kullanabilirsiniz, ancak kodu yeniden yayınlamanın Site Kurallarımıza tabi olduğunu unutmayın.
İlgili yayınlar
Feragatname
Bilgiler ve yayınlar, TradingView tarafından sağlanan veya onaylanan finansal, yatırım, işlem veya diğer türden tavsiye veya tavsiyeler anlamına gelmez ve teşkil etmez. Kullanım Şartları'nda daha fazlasını okuyun.