OPEN-SOURCE SCRIPT
Güncellendi Historical Pattern Matcher [Trendoscope]
Do you believe in patterns and think price movements are more likely to follow historical patterns? If yes, this is an indicator for you.
🎲 Concept
The patterns in this script are not a named or known pattern. But, it can be any pattern that happen to repeat again and again over a period of time.
The indicator collects the following information over a period of time.
And the indicator presents on chart following information
Please note that, if the patterns have not been repeated over a period, then it will not be shown on the screen. Hence, it is perfectly normal to not see any projection. This can happen when the current pattern has not been repeated any time before.
🎲 Details
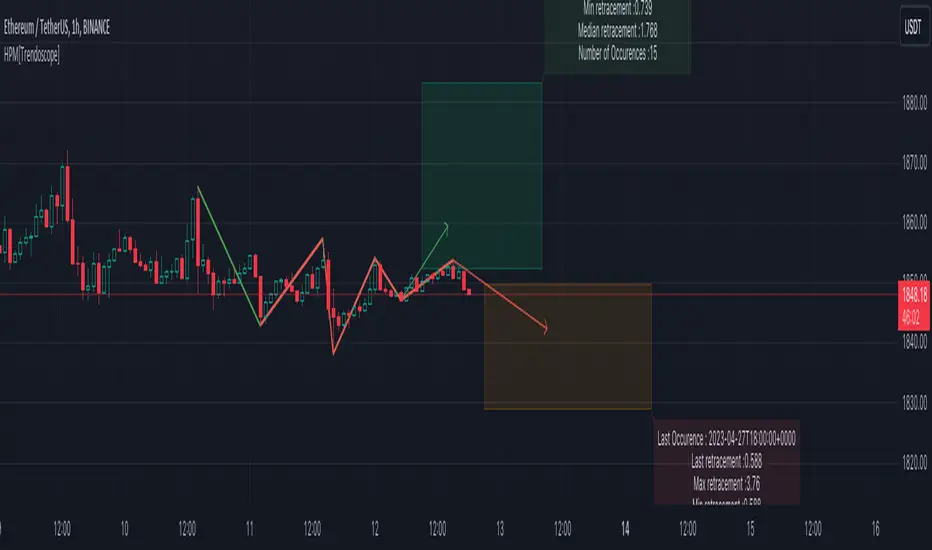
When you load the indicator on the chart, you may see the following patterns and projections.

You may also notice, in the pattern details, information about the last occurrence of the pattern. If you scroll on your chart to the left to the given data and time, you can observe how the past occurrence of the pattern has formed and the price movement past that point.
For example, last occurrence of pattern based on confirmed pivot happened on 02-Jun-2023 00:00 UTC time

And last occurrence of pattern based on unconfirmed pivot happened on 27-Apr-2023 22:00 UTC time

🎲 Settings
Settings are minimal, and here is the meaning of them.

Most important setting here is the number of pivots forming the pattern.
🎲 Caution
The indicator is designed to present the projection based on historical occurrences of similar price pattern. This does not necessarily mean the patterns are supposed to be bullish or bearish. But, it will certainly give users an idea of what happened when similar price action presented historically.
Note to developers This script makes use of new pine script feature - maps
🎲 Concept
The patterns in this script are not a named or known pattern. But, it can be any pattern that happen to repeat again and again over a period of time.
The indicator collects the following information over a period of time.
- Collects all possible patterns for specified number of pivots based on relation between each pivot prices. (Default 6)
- Keeps track of all the possible patterns for the given pivots and number of occurrences of such patterns over a period of time.
- Collects the movement of next pivot (in terms of retracement ratio) after the pattern has formed for each occurrence.
- Keeps track of the last occurrence of each pattern collected
And the indicator presents on chart following information
- Current Pattern drawing based on last confirmed pivot.
- Current Pattern drawing based on current unconfirmed pivot in the opposite direction.
- Projection range based on historical retracement ratio for both patterns
- Detailed info on last occurrence and overall occurrences.
- Last occurrence of both confirmed and unconfirmed pivot patterns.
Please note that, if the patterns have not been repeated over a period, then it will not be shown on the screen. Hence, it is perfectly normal to not see any projection. This can happen when the current pattern has not been repeated any time before.
🎲 Details
When you load the indicator on the chart, you may see the following patterns and projections.
You may also notice, in the pattern details, information about the last occurrence of the pattern. If you scroll on your chart to the left to the given data and time, you can observe how the past occurrence of the pattern has formed and the price movement past that point.
For example, last occurrence of pattern based on confirmed pivot happened on 02-Jun-2023 00:00 UTC time
And last occurrence of pattern based on unconfirmed pivot happened on 27-Apr-2023 22:00 UTC time
🎲 Settings
Settings are minimal, and here is the meaning of them.
Most important setting here is the number of pivots forming the pattern.
🎲 Caution
The indicator is designed to present the projection based on historical occurrences of similar price pattern. This does not necessarily mean the patterns are supposed to be bullish or bearish. But, it will certainly give users an idea of what happened when similar price action presented historically.
Note to developers This script makes use of new pine script feature - maps
Sürüm Notları
Updated display labelSürüm Notları
Update to V6Açık kaynak kodlu komut dosyası
Gerçek TradingView ruhuyla, bu komut dosyasının mimarı, yatırımcıların işlevselliğini inceleyip doğrulayabilmesi için onu açık kaynaklı hale getirdi. Yazarı tebrik ederiz! Ücretsiz olarak kullanabilseniz de, kodu yeniden yayınlamanın Topluluk Kurallarımıza tabi olduğunu unutmayın.
Trial - trendoscope.io/trial
Subscribe - trendoscope.io/pricing
Blog - docs.trendoscope.io
Subscribe - trendoscope.io/pricing
Blog - docs.trendoscope.io
Feragatname
Bilgiler ve yayınlar, TradingView tarafından sağlanan veya onaylanan finansal, yatırım, alım satım veya diğer türden tavsiye veya öneriler anlamına gelmez ve teşkil etmez. Kullanım Koşulları bölümünde daha fazlasını okuyun.
Açık kaynak kodlu komut dosyası
Gerçek TradingView ruhuyla, bu komut dosyasının mimarı, yatırımcıların işlevselliğini inceleyip doğrulayabilmesi için onu açık kaynaklı hale getirdi. Yazarı tebrik ederiz! Ücretsiz olarak kullanabilseniz de, kodu yeniden yayınlamanın Topluluk Kurallarımıza tabi olduğunu unutmayın.
Trial - trendoscope.io/trial
Subscribe - trendoscope.io/pricing
Blog - docs.trendoscope.io
Subscribe - trendoscope.io/pricing
Blog - docs.trendoscope.io
Feragatname
Bilgiler ve yayınlar, TradingView tarafından sağlanan veya onaylanan finansal, yatırım, alım satım veya diğer türden tavsiye veya öneriler anlamına gelmez ve teşkil etmez. Kullanım Koşulları bölümünde daha fazlasını okuyun.