PROTECTED SOURCE SCRIPT
Signifikante Hochs
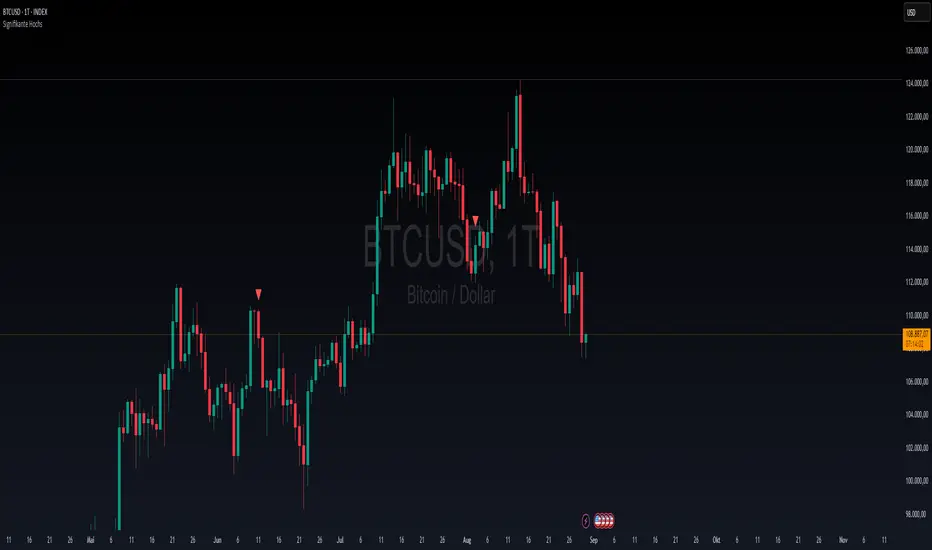
This indicator was created to highlight significant highs in the price chart. It is intentionally kept simple and lightweight, since its primary purpose is to serve as a test and learning tool for exploring the functions of the TradingView platform.
How it works:
A user-defined lookback period is applied to check whether a local high has been formed.
A minimum percentage change threshold is used as an additional filter, so that only highs with a certain level of significance are marked.
Once such a high is detected, a visual marker is plotted above the corresponding candle.
The main goal of this script is not to provide a complete trading strategy, but rather to help users understand the basic elements of Pine Script, chart visualization, and platform workflows. In particular, this script is a practical way to test and demonstrate:
The use of input parameters.
Core functions such as ta.pivothigh.
Conditional checks for price significance.
Simple plotting of signals directly on the chart.
At the same time, this test indicator can serve as a foundation for further development. The logic can easily be extended to:
Display significant lows as well as highs.
Draw connecting trendlines between pivots.
Generate alerts whenever a new significant high appears.
Incorporate multi-timeframe logic for deeper analysis.
Important note:
This script is not intended to be a full trading strategy in its current form. Instead, it acts as a test environment for learning how to publish, manage, and experiment with indicators on TradingView.
For the TradingView community, this simple tool can still be valuable, as it provides a quick visual reference for key highs that traders may use as additional context in their market analysis.
Korumalı komut dosyası
Bu komut dosyası kapalı kaynak olarak yayınlanmaktadır. Ancak, ücretsiz ve herhangi bir sınırlama olmaksızın kullanabilirsiniz – daha fazla bilgiyi buradan edinebilirsiniz.
Feragatname
Bilgiler ve yayınlar, TradingView tarafından sağlanan veya onaylanan finansal, yatırım, alım satım veya diğer türden tavsiye veya öneriler anlamına gelmez ve teşkil etmez. Kullanım Koşulları bölümünde daha fazlasını okuyun.