OPEN-SOURCE SCRIPT
unRekt - KISS Marsie
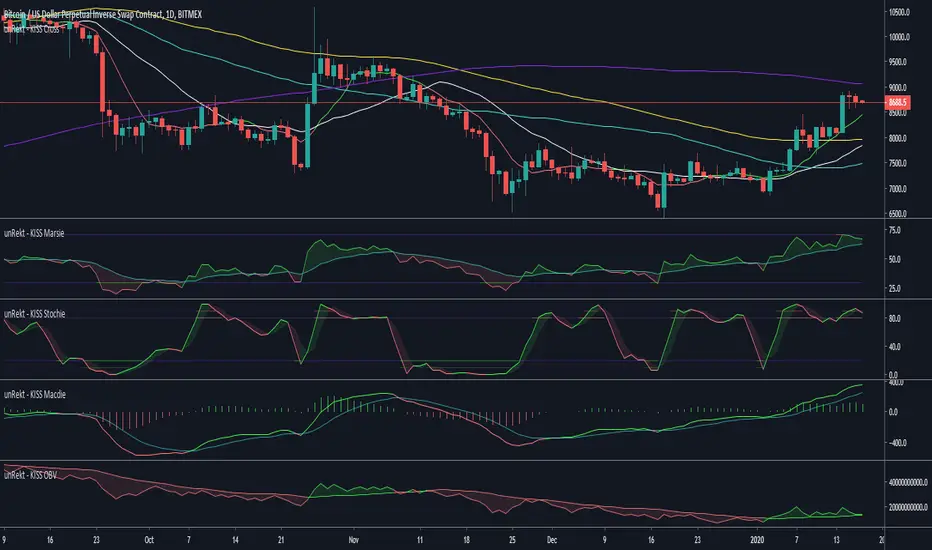
Marsie is an EMA-RSI indicator and part of the 'keeping it simple' series that have a similar color scheme. The RSI 'Relative Strength Index' is a momentum oscillator, measuring the velocity and magnitude of directional price movements. it is measured from 0 - 100 with 30 and 70 being low "oversold" and high "overbought" conditions. It is also commonly used to determine bullish or bearish divergences.
The EMA aspect is the 'Exponential Moving Average' which has had the RSI calculation added to it and acts a signal line when the RSI crosses it for buy and sell opportunities.
The EMA aspect is the 'Exponential Moving Average' which has had the RSI calculation added to it and acts a signal line when the RSI crosses it for buy and sell opportunities.
Açık kaynak kodlu komut dosyası
Gerçek TradingView ruhuyla, bu komut dosyasının mimarı, yatırımcıların işlevselliğini inceleyip doğrulayabilmesi için onu açık kaynaklı hale getirdi. Yazarı tebrik ederiz! Ücretsiz olarak kullanabilseniz de, kodu yeniden yayınlamanın Topluluk Kurallarımıza tabi olduğunu unutmayın.
Feragatname
Bilgiler ve yayınlar, TradingView tarafından sağlanan veya onaylanan finansal, yatırım, alım satım veya diğer türden tavsiye veya öneriler anlamına gelmez ve teşkil etmez. Kullanım Koşulları bölümünde daha fazlasını okuyun.