OPEN-SOURCE SCRIPT
Advanced RSI with Divergence RCT
This indicator provides a comprehensive RSI analysis tool by combining the classic Relative Strength Index (RSI) with a smoothing Simple Moving Average (SMA), clearly defined overbought/oversold zones, and an advanced divergence detection engine.
--- Key Features ---
1. RSI with SMA: Plots the standard RSI along with a user-defined SMA of the RSI. This helps to smooth out price action and confirm the underlying trend, identifying potential buy/sell signals on crossovers.
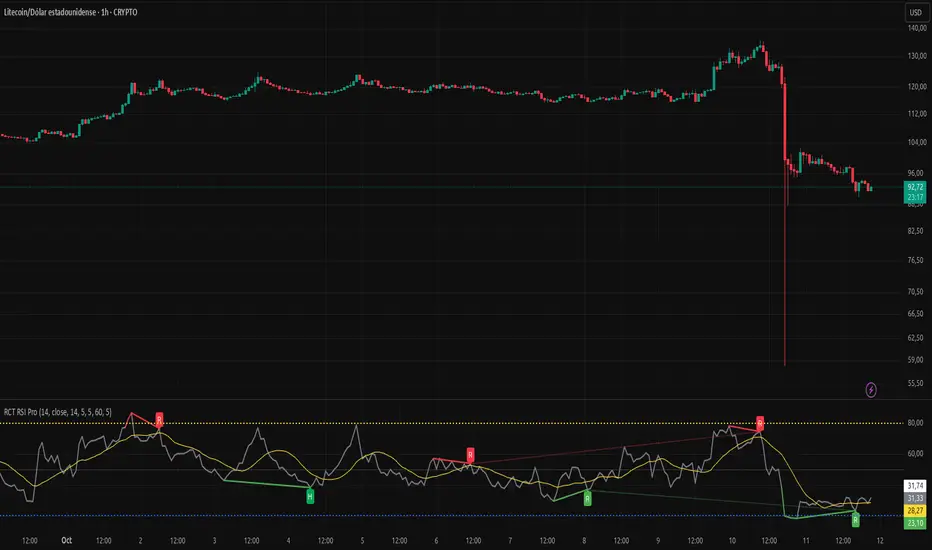
2. Overbought/Oversold Levels: Highlights the extreme zones with dotted horizontal lines at 80 (overbought) and 20 (oversold), providing clear visual cues for potential market reversals.
3. Advanced Divergence Detection: Automatically identifies and plots both regular and hidden divergences (bullish and bearish) directly on the chart. This helps traders spot potential reversals that are not obvious from price action alone.
--- How to Use ---
- Trend Confirmation: When the RSI crosses above its SMA, it can signal a strengthening bullish trend. A cross below can signal a strengthening bearish trend.
- Reversal Zones: When the RSI enters the overbought zone (>80) or oversold zone (<20), traders may watch for a reversal in price.
- Divergence Signals:
- A Bullish Divergence (green label 'R') occurs when the price makes a lower low, but the RSI makes a higher low, suggesting downward momentum is fading.
- A Bearish Divergence (red label 'R') occurs when the price makes a higher high, but the RSI makes a lower high, suggesting upward momentum is fading.
- Hidden Divergences ('H' labels) can indicate the continuation of an existing trend.
--- Disclaimer ---
This script is for informational and educational purposes only. It is not financial advice. Past performance is not indicative of future results. Always do your own research before making any trading decisions.
--- Key Features ---
1. RSI with SMA: Plots the standard RSI along with a user-defined SMA of the RSI. This helps to smooth out price action and confirm the underlying trend, identifying potential buy/sell signals on crossovers.
2. Overbought/Oversold Levels: Highlights the extreme zones with dotted horizontal lines at 80 (overbought) and 20 (oversold), providing clear visual cues for potential market reversals.
3. Advanced Divergence Detection: Automatically identifies and plots both regular and hidden divergences (bullish and bearish) directly on the chart. This helps traders spot potential reversals that are not obvious from price action alone.
--- How to Use ---
- Trend Confirmation: When the RSI crosses above its SMA, it can signal a strengthening bullish trend. A cross below can signal a strengthening bearish trend.
- Reversal Zones: When the RSI enters the overbought zone (>80) or oversold zone (<20), traders may watch for a reversal in price.
- Divergence Signals:
- A Bullish Divergence (green label 'R') occurs when the price makes a lower low, but the RSI makes a higher low, suggesting downward momentum is fading.
- A Bearish Divergence (red label 'R') occurs when the price makes a higher high, but the RSI makes a lower high, suggesting upward momentum is fading.
- Hidden Divergences ('H' labels) can indicate the continuation of an existing trend.
--- Disclaimer ---
This script is for informational and educational purposes only. It is not financial advice. Past performance is not indicative of future results. Always do your own research before making any trading decisions.
Açık kaynak kodlu komut dosyası
Gerçek TradingView ruhuna uygun olarak, bu komut dosyasının oluşturucusu bunu açık kaynaklı hale getirmiştir, böylece yatırımcılar betiğin işlevselliğini inceleyip doğrulayabilir. Yazara saygı! Ücretsiz olarak kullanabilirsiniz, ancak kodu yeniden yayınlamanın Site Kurallarımıza tabi olduğunu unutmayın.
Feragatname
Bilgiler ve yayınlar, TradingView tarafından sağlanan veya onaylanan finansal, yatırım, işlem veya diğer türden tavsiye veya tavsiyeler anlamına gelmez ve teşkil etmez. Kullanım Şartları'nda daha fazlasını okuyun.