PROTECTED SOURCE SCRIPT
Güncellendi db/dt [keypoems]
Double Top / Double Bottom Marker
This indicator identifies classic double bottom/double top reversal patterns using pivot point analysis and breakout confirmation methodology, it also marks pivot based market structure shifts or flips.
WHAT IT DOES
The indicator detects two primary types of trading patterns:
1. Double Bottom/Top Patterns: Recognizes classic reversal formations where price creates two similar highs or lows before breaking the neckline
2. Market Structure Shifts (Flips): Identifies when price breaks through significant pivot levels indicating a potential trend change
HOW IT WORKS
Double Pattern Detection:
For double bottoms, the system identifies the first pivot low, then tracks the highest point between potential lows to establish the neckline level. It searches for a second pivot low within the specified price tolerance percentage of the first low. The pattern confirms when price breaks above the neckline. Double tops use the same logic but inverted, tracking the lowest point for the neckline and confirming on downward breaks.
Pattern Invalidation:
Double patterns are automatically invalidated if price creates new extremes beyond both pivot points before neckline confirmation occurs.
Flip Detection:
The algorithm uses a three-step process for each direction. For bullish shifts, it first identifies a pivot high using the specified left/right bar length parameters. It then waits for a subsequent pivot low that occurs after the pivot high. Finally, it confirms the shift when price closes above the original pivot high level. The bearish detection works inversely, starting with a pivot low, followed by a pivot high, and confirmed when price closes below the original pivot low.
CONFIGURATION OPTIONS
General Settings:
- Pivot High/Low Length: Controls the number of bars required on each side of a pivot point for validation
- Start Bar Index: Sets how many bars from the beginning of data to start pattern detection
- Time Filter: Optional start time to limit detection to specific periods
Double Pattern Settings:
- Separate pivot length controls for each pattern type
- Price Tolerance: Maximum percentage difference allowed between the two pivot points to qualify as a double pattern (0.1% to 20%)
- Individual start bar settings for each pattern type
Visual Controls:
- Toggle display for bullish flips, bearish flips, double bottoms, and double tops
- Optional text labels for each pattern type
- Sweep/Mitigation classification labels that distinguish between patterns where the second pivot sweeps beyond the first versus those that hold within tolerance
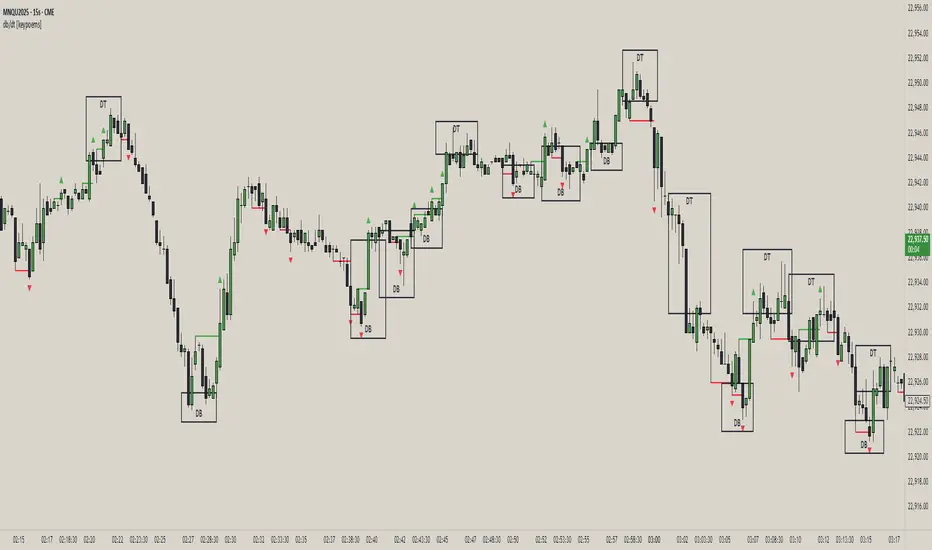
VISUAL PRESENTATION
Market structure shifts display as triangular markers above or below price with connecting lines that extend from the original pivot point to the breakout confirmation bar. Double patterns appear as rectangular boxes that encompass both pivot points with pattern type labels. The boxes automatically size themselves based on the price range and bar spacing of the pattern.
Color coding uses green for bullish signals, red for bearish signals, blue for double bottoms, and orange for double tops. All visual elements can be individually enabled or disabled based on trading preferences.
UNDERLYING CONCEPTS
This indicator applies market structure theory which suggests that trend changes are often preceded by breaks of significant swing points. The double pattern recognition is based on classical technical analysis principles where price creates similar levels twice before reversing direction, indicating exhaustion of the prevailing trend.
The pivot point methodology ensures that only statistically significant highs and lows are considered, filtering out minor fluctuations that might create false signals. The confirmation requirement prevents premature signals during consolidation phases.
PRACTICAL APPLICATION
Market structure shifts help identify potential trend changes early in their development. Double patterns provide high-probability reversal setups with clear entry levels at neckline breaks and logical stop placements beyond the pattern extremes.
The price tolerance setting allows adaptation to different market volatility conditions. Tighter tolerances work better in stable markets while looser tolerances accommodate more volatile instruments.
LIMITATIONS AND CONSIDERATIONS
This indicator works best in trending markets and may produce less reliable signals during extended sideways consolidation periods. The pivot-based approach means signals occur with some delay after actual market turns, as confirmation requires subsequent price action.
Users should be aware that the indicator plots historical patterns and breakout confirmations. Real-time trading decisions should account for the lag inherent in pivot point calculation and pattern completion requirements.
The effectiveness of detected patterns may vary significantly across different timeframes, market conditions, and instrument types. Combining these signals with additional analysis methods and proper risk management is recommended for practical trading applications.
Double pattern detection requires sufficient price history and bar spacing to properly identify and validate formations. Very short timeframes or instruments with limited volatility may not generate frequent pattern signals.
All pattern recognition is based on historical price data and does not guarantee future performance. Market conditions, fundamental factors, and external events can invalidate technical patterns regardless of their historical reliability.
This indicator identifies classic double bottom/double top reversal patterns using pivot point analysis and breakout confirmation methodology, it also marks pivot based market structure shifts or flips.
WHAT IT DOES
The indicator detects two primary types of trading patterns:
1. Double Bottom/Top Patterns: Recognizes classic reversal formations where price creates two similar highs or lows before breaking the neckline
2. Market Structure Shifts (Flips): Identifies when price breaks through significant pivot levels indicating a potential trend change
HOW IT WORKS
Double Pattern Detection:
For double bottoms, the system identifies the first pivot low, then tracks the highest point between potential lows to establish the neckline level. It searches for a second pivot low within the specified price tolerance percentage of the first low. The pattern confirms when price breaks above the neckline. Double tops use the same logic but inverted, tracking the lowest point for the neckline and confirming on downward breaks.
Pattern Invalidation:
Double patterns are automatically invalidated if price creates new extremes beyond both pivot points before neckline confirmation occurs.
Flip Detection:
The algorithm uses a three-step process for each direction. For bullish shifts, it first identifies a pivot high using the specified left/right bar length parameters. It then waits for a subsequent pivot low that occurs after the pivot high. Finally, it confirms the shift when price closes above the original pivot high level. The bearish detection works inversely, starting with a pivot low, followed by a pivot high, and confirmed when price closes below the original pivot low.
CONFIGURATION OPTIONS
General Settings:
- Pivot High/Low Length: Controls the number of bars required on each side of a pivot point for validation
- Start Bar Index: Sets how many bars from the beginning of data to start pattern detection
- Time Filter: Optional start time to limit detection to specific periods
Double Pattern Settings:
- Separate pivot length controls for each pattern type
- Price Tolerance: Maximum percentage difference allowed between the two pivot points to qualify as a double pattern (0.1% to 20%)
- Individual start bar settings for each pattern type
Visual Controls:
- Toggle display for bullish flips, bearish flips, double bottoms, and double tops
- Optional text labels for each pattern type
- Sweep/Mitigation classification labels that distinguish between patterns where the second pivot sweeps beyond the first versus those that hold within tolerance
VISUAL PRESENTATION
Market structure shifts display as triangular markers above or below price with connecting lines that extend from the original pivot point to the breakout confirmation bar. Double patterns appear as rectangular boxes that encompass both pivot points with pattern type labels. The boxes automatically size themselves based on the price range and bar spacing of the pattern.
Color coding uses green for bullish signals, red for bearish signals, blue for double bottoms, and orange for double tops. All visual elements can be individually enabled or disabled based on trading preferences.
UNDERLYING CONCEPTS
This indicator applies market structure theory which suggests that trend changes are often preceded by breaks of significant swing points. The double pattern recognition is based on classical technical analysis principles where price creates similar levels twice before reversing direction, indicating exhaustion of the prevailing trend.
The pivot point methodology ensures that only statistically significant highs and lows are considered, filtering out minor fluctuations that might create false signals. The confirmation requirement prevents premature signals during consolidation phases.
PRACTICAL APPLICATION
Market structure shifts help identify potential trend changes early in their development. Double patterns provide high-probability reversal setups with clear entry levels at neckline breaks and logical stop placements beyond the pattern extremes.
The price tolerance setting allows adaptation to different market volatility conditions. Tighter tolerances work better in stable markets while looser tolerances accommodate more volatile instruments.
LIMITATIONS AND CONSIDERATIONS
This indicator works best in trending markets and may produce less reliable signals during extended sideways consolidation periods. The pivot-based approach means signals occur with some delay after actual market turns, as confirmation requires subsequent price action.
Users should be aware that the indicator plots historical patterns and breakout confirmations. Real-time trading decisions should account for the lag inherent in pivot point calculation and pattern completion requirements.
The effectiveness of detected patterns may vary significantly across different timeframes, market conditions, and instrument types. Combining these signals with additional analysis methods and proper risk management is recommended for practical trading applications.
Double pattern detection requires sufficient price history and bar spacing to properly identify and validate formations. Very short timeframes or instruments with limited volatility may not generate frequent pattern signals.
All pattern recognition is based on historical price data and does not guarantee future performance. Market conditions, fundamental factors, and external events can invalidate technical patterns regardless of their historical reliability.
Sürüm Notları
Change flags to show DB/DT and Flips.Korumalı komut dosyası
Bu komut dosyası kapalı kaynak olarak yayınlanmaktadır. Ancak, ücretsiz ve herhangi bir sınırlama olmaksızın kullanabilirsiniz – daha fazla bilgiyi buradan edinebilirsiniz.
Feragatname
Bilgiler ve yayınlar, TradingView tarafından sağlanan veya onaylanan finansal, yatırım, alım satım veya diğer türden tavsiye veya öneriler anlamına gelmez ve teşkil etmez. Kullanım Koşulları bölümünde daha fazlasını okuyun.
Korumalı komut dosyası
Bu komut dosyası kapalı kaynak olarak yayınlanmaktadır. Ancak, ücretsiz ve herhangi bir sınırlama olmaksızın kullanabilirsiniz – daha fazla bilgiyi buradan edinebilirsiniz.
Feragatname
Bilgiler ve yayınlar, TradingView tarafından sağlanan veya onaylanan finansal, yatırım, alım satım veya diğer türden tavsiye veya öneriler anlamına gelmez ve teşkil etmez. Kullanım Koşulları bölümünde daha fazlasını okuyun.