OPEN-SOURCE SCRIPT
Güncellendi Master Simple Indicator
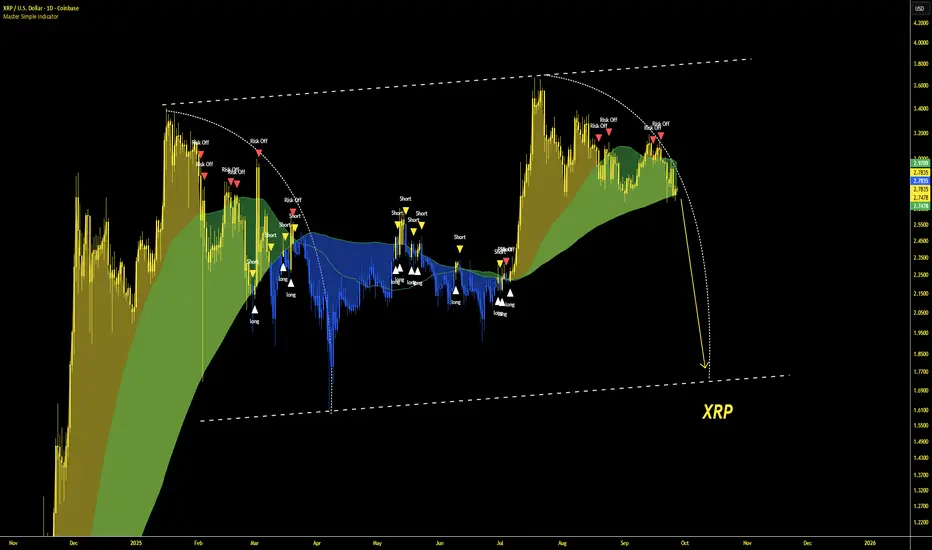
The streamlined Pine Script, created by masterbtcltc, is a technical analysis indicator that overlays on a price chart to provide buy and sell signals based on a dynamic 120-day simple moving average (SMA). Here's how it works:
Dynamic Moving Average: Calculates a 120-day SMA (ma_dynamic) using closing prices to smooth out price fluctuations and identify trends.
Buy/Sell Signals:
Buy Signal: Triggered when the closing price crosses above the 120-day SMA (longSignal), indicating potential bullish momentum. A white triangle with "close" text appears below the bar.
Sell Signal: Triggered when the closing price crosses below the 120-day SMA (shortSignal), suggesting bearish momentum. A yellow triangle with "Short" text appears above the bar.
Alerts: Generates alerts for buy (Long Signal Alert) and sell (Short Signal Alert) signals, notifying users when the price crosses the SMA.
Visual Highlights:
Price vs. SMA: The area between the closing price and the 120-day SMA is filled with yellow if the price is above the SMA (bullish) or blue if below (bearish).
50-day vs. 120-day SMA: The area between the 50-day SMA and 120-day SMA is filled green when the 50-day SMA is above the 120-day SMA, indicating a stronger bullish trend.
Created by masterbtcltc, this indicator helps traders identify trend changes and potential entry/exit points based on price interactions with the 120-day SMA, with clear visual cues and alerts for decision-making.
Sürüm Notları
text changeSürüm Notları
added risk off and candle color changes so hide the main assetAçık kaynak kodlu komut dosyası
Gerçek TradingView ruhuyla, bu komut dosyasının mimarı, yatırımcıların işlevselliğini inceleyip doğrulayabilmesi için onu açık kaynaklı hale getirdi. Yazarı tebrik ederiz! Ücretsiz olarak kullanabilseniz de, kodu yeniden yayınlamanın Topluluk Kurallarımıza tabi olduğunu unutmayın.
Feragatname
Bilgiler ve yayınlar, TradingView tarafından sağlanan veya onaylanan finansal, yatırım, alım satım veya diğer türden tavsiye veya öneriler anlamına gelmez ve teşkil etmez. Kullanım Koşulları bölümünde daha fazlasını okuyun.
Açık kaynak kodlu komut dosyası
Gerçek TradingView ruhuyla, bu komut dosyasının mimarı, yatırımcıların işlevselliğini inceleyip doğrulayabilmesi için onu açık kaynaklı hale getirdi. Yazarı tebrik ederiz! Ücretsiz olarak kullanabilseniz de, kodu yeniden yayınlamanın Topluluk Kurallarımıza tabi olduğunu unutmayın.
Feragatname
Bilgiler ve yayınlar, TradingView tarafından sağlanan veya onaylanan finansal, yatırım, alım satım veya diğer türden tavsiye veya öneriler anlamına gelmez ve teşkil etmez. Kullanım Koşulları bölümünde daha fazlasını okuyun.