INVITE-ONLY SCRIPT
Güncellendi Combined Open and Close Volume Momentum
Combined Open and Close Volume Momentum Indicator
This indicator calculates and visualizes the momentum of Open and Close volumes based on changes in Open Interest (OI) and price direction. It provides traders with a clear view of volume dynamics and their impact on market momentum.
Key Features:
Use Case:
This indicator is ideal for futures traders who want to:
How It Works:
This indicator calculates and visualizes the momentum of Open and Close volumes based on changes in Open Interest (OI) and price direction. It provides traders with a clear view of volume dynamics and their impact on market momentum.
Key Features:
- Open Volume Momentum: Tracks the momentum of volume associated with new positions being opened.
Differentiates between green candles (positive momentum) and red candles (negative momentum).
Accumulates momentum over time, with an option to reset periodically. - Close Volume Momentum: Tracks the momentum of volume associated with closing existing positions.
Momentum is weighted by price direction:
Price increase → Positive momentum.
Price decrease → Negative momentum.
Accumulates momentum over time, with an option to reset periodically. - Reset Functionality: Allows traders to reset accumulated momentum after a specified period (in days).
Customizable reset period for both Open and Close volume momentum. - Visual Representation:
- Green Line → Positive Open Volume Momentum.
- Red Line → Negative Open Volume Momentum.
- Blue Line → Positive Close Volume Momentum.
- Orange Line → Negative Close Volume Momentum.
- Includes a gray dotted zero line for reference.
- Green Line → Positive Open Volume Momentum.
Use Case:
This indicator is ideal for futures traders who want to:
- Analyze the impact of volume dynamics on market momentum.
- Differentiate between momentum caused by opening new positions and closing existing positions.
- Identify trends and reversals based on volume and price action.
- Reset momentum data periodically for fresh analysis.
How It Works:
- Open Volume Momentum: Calculated from Open Interest changes when new positions are opened.
Green candles → Positive momentum.
Red candles → Negative momentum.
Accumulated over time, with optional periodic resets. - Close Volume Momentum: Calculated from volume associated with closing positions.
Momentum is weighted by price direction:
Price increases → Positive contribution.
Price decreases → Negative contribution.
Accumulated over time, with optional periodic resets. - Reset Functionality: Enabled by default and customizable through input settings.
Reset period is defined in days. - Visualization:
- Open Volume Momentum is plotted as a line that changes color:
Green Line → Positive momentum.
Red Line → Negative momentum. - Close Volume Momentum is plotted as a line that changes color:
Blue Line → Positive momentum.
Orange Line → Negative momentum. - A gray dotted zero line is included for reference.
- Open Volume Momentum is plotted as a line that changes color:
Sürüm Notları
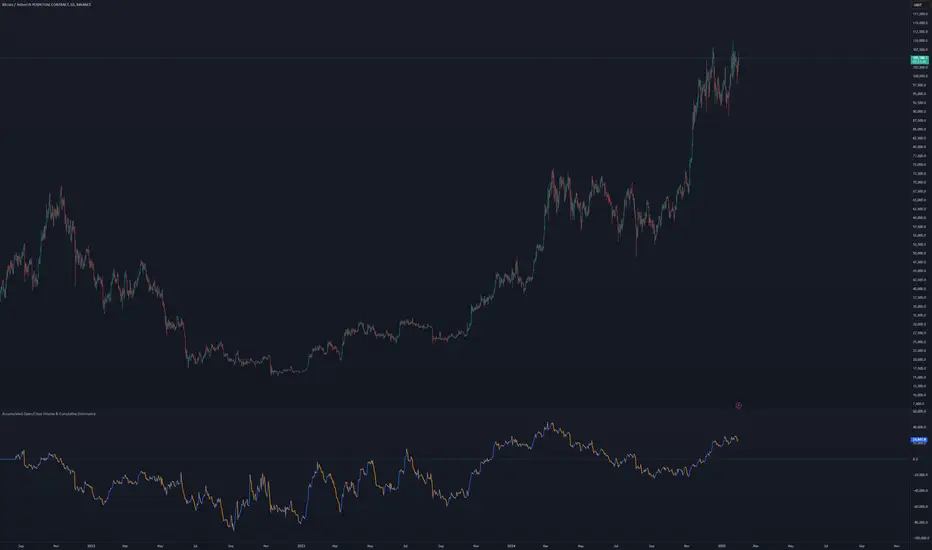
Accumulated Open/Close Volume Dominance (With Reset)A powerful volume-based indicator that tracks dominant Open & Close Volume to identify market absorption and momentum shifts.
Updated version with reset functionality and improved dominance-based tracking.
📌 Key Features:
- [] Dominant Volume Tracking → Only accumulates the strongest volume type per candle (Open or Close).
[] Accumulated Momentum → Shows the continuous trend of Open & Close Volume over time.
[] Reset Functionality → Optional setting to restart accumulation every X days.
[] Customizable Colors → User-defined colors for Open & Close Volume trends. - Toggle Display → Enable/disable Open & Close Volume separately for better clarity.
📊 How It Works:
- [] If Open Volume dominates, the Open Volume line moves while the Close Volume line stays flat.
[] If Close Volume dominates, the Close Volume line moves while the Open Volume line stays flat.
[] If price moves up with Open Volume, it suggests aggressive buying.
[] If price moves down with Close Volume, it suggests long exits or short covering. - When both lines flatten, it indicates volume balance (consolidation).
📌 How to Use in Trading:
If Open Volume (Blue/Orange) dominates, market is accumulating new positions.
If Close Volume (Green/Red) dominates, traders are exiting positions.
If the Reset feature is enabled, the indicator restarts accumulation every X days.
Compare Open & Close Volume trends with price action for market bias.
🚀 Updates & Improvements:
- [] Bug Fix → Reset period now properly resets only at the defined time.
[] Better Trend Clarity → Lines move only when dominant, reducing noise. - Stronger Visuals → Smoothed line behavior for better market absorption analysis.
💡 Notes:
- [] Ideal for Futures & Crypto markets, where Open Interest data is available.
[] Use on higher timeframes (15m, 1H, 4H, etc.) for best results. - Combining with Price Action & Liquidity Concepts enhances accuracy.
Sürüm Notları
🆕 New Features & Enhancements✅ Cumulative Dominance Calculation
Added a new cumulative dominance line that accumulates only dominant open or close volume.
Logic: If open dominance is greater, it accumulates open volume based on price movement; if close dominance is greater, it accumulates close volume.
Purpose: Helps track whether the market is being driven more by contract openings (aggressive market participation) or closings (profit-taking or liquidations).
Yalnızca davetli komut dosyası
Bu komut dosyasına erişim, yazar tarafından yetkilendirilen kullanıcılarla sınırlıdır ve genellikle ödeme gerektirir. Sık kullanılanlarınıza ekleyebilirsiniz, ancak bunu yalnızca izin talep edip yazarından bu izni aldıktan sonra kullanabileceksiniz. Daha fazla bilgi için Angick ile iletişime geçin veya yazarın aşağıdaki talimatlarını izleyin.
TradingView, yazarına %100 güvenmediğiniz ve komut dosyasının nasıl çalıştığını anlamadığınız sürece bir komut dosyası için ödeme yapmanızı ve onu kullanmanızı önermez. Çoğu durumda, Topluluk Komut Dosyaları bölümümüzde ücretsiz olarak iyi bir açık kaynak alternatifi bulabilirsiniz.
Yazarın talimatları
″Terms of Use:
"By requesting access to this script, you agree to use it for personal trading purposes only. Redistribution is prohibited."
Request:
"Send me a private message on TradingView with your username and reason for requesting access."
Bu komut dosyasını bir grafikte kullanmak ister misiniz?
Uyarı: Erişim talebinde bulunmadan önce lütfen okuyun.
Feragatname
Bilgiler ve yayınlar, TradingView tarafından sağlanan veya onaylanan finansal, yatırım, işlem veya diğer türden tavsiye veya tavsiyeler anlamına gelmez ve teşkil etmez. Kullanım Şartları'nda daha fazlasını okuyun.