PROTECTED SOURCE SCRIPT
MACD Reversal Indicator
MACD Reversal – Indicator Description
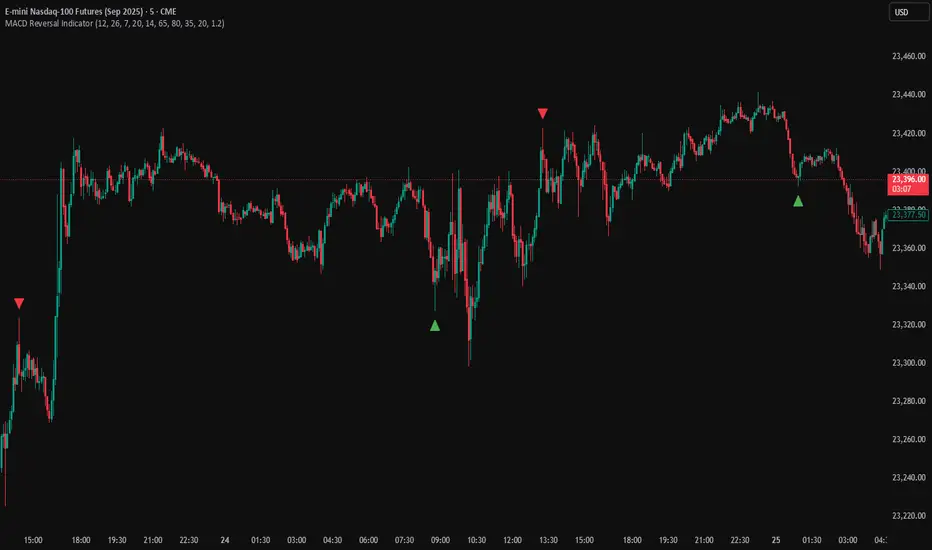
This indicator highlights potential market reversals by combining momentum, volume, and candlestick behavior into a single signal. A marker appears on the chart when several filters (MACD, RSI, Volume, Candle Patterns) align, aiming to capture points where price may be overextended and ready to turn.
The goal is not to generate frequent signals, but to isolate moments where the probability of a shift in direction may be higher.
How to Use
This tool is best used as part of a broader trading framework — for confirmation, not for isolated entries or exits. It may serve well for spotting exhaustion in trends or for identifying possible fade setups, depending on your trading style.
Important Note
The accuracy and usefulness of the signals can vary depending on the market, asset, and timeframe. It may work better in certain conditions than others. Users are strongly advised to backtest and forward-test the indicator thoroughly before making decisions based on it.
Here are some chart examples:


Downside of this indicator (strong trend) example:

This indicator highlights potential market reversals by combining momentum, volume, and candlestick behavior into a single signal. A marker appears on the chart when several filters (MACD, RSI, Volume, Candle Patterns) align, aiming to capture points where price may be overextended and ready to turn.
The goal is not to generate frequent signals, but to isolate moments where the probability of a shift in direction may be higher.
How to Use
This tool is best used as part of a broader trading framework — for confirmation, not for isolated entries or exits. It may serve well for spotting exhaustion in trends or for identifying possible fade setups, depending on your trading style.
Important Note
The accuracy and usefulness of the signals can vary depending on the market, asset, and timeframe. It may work better in certain conditions than others. Users are strongly advised to backtest and forward-test the indicator thoroughly before making decisions based on it.
Here are some chart examples:
Downside of this indicator (strong trend) example:
Korumalı komut dosyası
Bu komut dosyası kapalı kaynak olarak yayınlanmaktadır. Ancak, özgürce ve herhangi bir sınırlama olmaksızın kullanabilirsiniz – daha fazla bilgi burada.
Feragatname
Bilgiler ve yayınlar, TradingView tarafından sağlanan veya onaylanan finansal, yatırım, işlem veya diğer türden tavsiye veya tavsiyeler anlamına gelmez ve teşkil etmez. Kullanım Şartları'nda daha fazlasını okuyun.