INVITE-ONLY SCRIPT
Advanced Short Volume

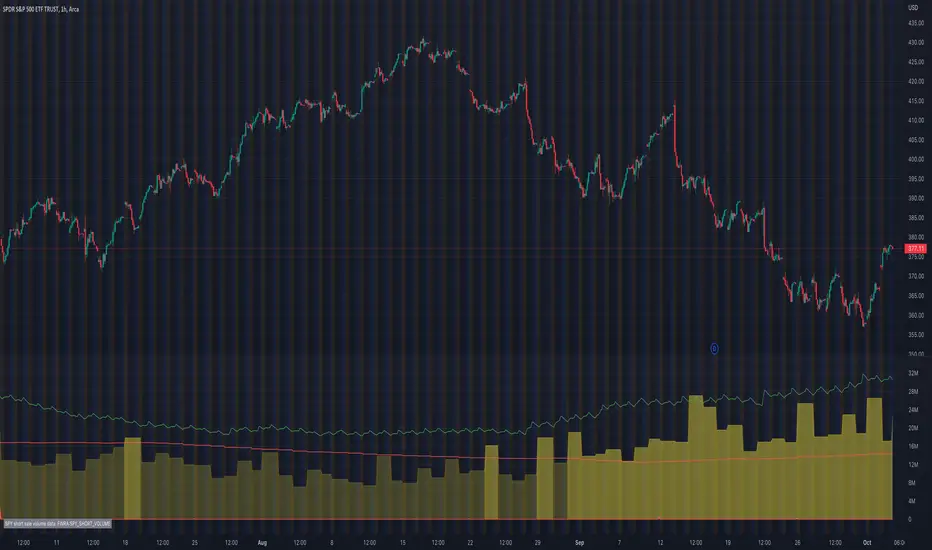
This script is designed to show you the intensity of short selling in the market using a few different factors, to allow you to make more clearer decisions. Instead of boiling everything down into a simple number, the indicator will show a few factors at the same time, such as the daily short volume sale, short volume moving average, final supply volume and short volume ratio. Each one is explained below.
Daily short volume sale is simple, it's basically the amount of short sales, less transparent ones mean the short volume is higher than previous week same time
Red line is the average short volume, telling you the direction of the short volume which can be useful. You can change the moving average length of it in settings.
Green line is market volume sentiment. It's basically volume minus the short volume with a few other formulas involved to create a pure volume number. When below average short volume (the red line), it means that the market is bearish or there is fear. Keep in mind that this can look different in different timelines and sometimes market value sentiment line can be below short line but stock still could go up and this is by design (by design). The idea is to provide you a level of information beyond just numbers for better decisions. Keep in mind that this indicator is best used for 1 to 6 month charts and not very effective to use for day trading as it's hard to get that type of data live.
Small Red spikes are short volume ratio compared to daily volume. This tells if there is a big change in the short volume and might indicate a down turn.
I created this indicator to get an idea of the direction of the market beyond average volume and etc.. but I recommend using this with other indicators for maximum effectiveness and more importantly, this is best when used for swing trading.
Yalnızca davetli komut dosyası
Bu komut dosyasına erişim, yazar tarafından yetkilendirilen kullanıcılarla sınırlıdır ve genellikle ödeme gerektirir. Sık kullanılanlarınıza ekleyebilirsiniz, ancak bunu yalnızca izin talep edip yazarından bu izni aldıktan sonra kullanabileceksiniz. Daha fazla bilgi için EdgeTerminal ile iletişime geçin veya yazarın aşağıdaki talimatlarını izleyin.
TradingView, yazarına %100 güvenmediğiniz ve komut dosyasının nasıl çalıştığını anlamadığınız sürece bir komut dosyası için ödeme yapmanızı ve onu kullanmanızı önermez. Çoğu durumda, Topluluk Komut Dosyaları bölümümüzde ücretsiz olarak iyi bir açık kaynak alternatifi bulabilirsiniz.
Yazarın talimatları
″please send me a message to access the script.
Bu komut dosyasını bir grafikte kullanmak ister misiniz?
Uyarı: Erişim talebinde bulunmadan önce lütfen okuyun.
Indicators: edgeterminal.com/access
YouTube: youtube.com/@edgeterminal/
YouTube: youtube.com/@edgeterminal/
Feragatname
Bilgiler ve yayınlar, TradingView tarafından sağlanan veya onaylanan finansal, yatırım, işlem veya diğer türden tavsiye veya tavsiyeler anlamına gelmez ve teşkil etmez. Kullanım Şartları'nda daha fazlasını okuyun.