OPEN-SOURCE SCRIPT
Relative Strength Market Picker
Modified to code from modhelius and added colors and histogram for easy reading...thanks to him...
What is Relative Strength?
Relative strength is a ratio of a stock price performance to a market average (index) performance. It is used in technical analysis.
It is not to be confused with relative strength index.
To calculate the relative strength of a particular stock, divide the percentage change over some time period by the percentage change of a particular index over the same time period.
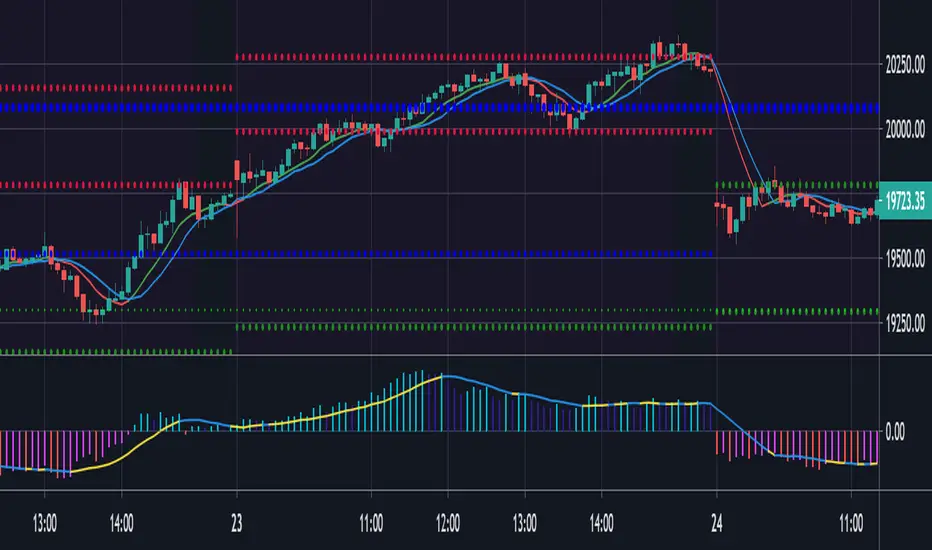
How to read this indicator for trading and decesion making?
There are four colors
Aqua: Shows the bullish momentum against the index of your choosing
Navy blue: Show the bearish momentum is weakning at the time period
Fuschsia : Shows the bullish gaining strength and about to cross zero line
Red: Shows the bearish momentum is strong.
Other indicators to be used along with this are
1. Pivot points
2. Moving Average of highs and lows -- 17 period
To take long calls --- There has to be high closing candle above the 17 period moving average of highs and there has to be bullish momentum and ideally with the pivot point as a support
To take short calls -- There has to low closing candle below the 17 period moving average of lows and there has to be bearish momentum and ideally with the pivot point as a resistance.


What is Relative Strength?
Relative strength is a ratio of a stock price performance to a market average (index) performance. It is used in technical analysis.
It is not to be confused with relative strength index.
To calculate the relative strength of a particular stock, divide the percentage change over some time period by the percentage change of a particular index over the same time period.
How to read this indicator for trading and decesion making?
There are four colors
Aqua: Shows the bullish momentum against the index of your choosing
Navy blue: Show the bearish momentum is weakning at the time period
Fuschsia : Shows the bullish gaining strength and about to cross zero line
Red: Shows the bearish momentum is strong.
Other indicators to be used along with this are
1. Pivot points
2. Moving Average of highs and lows -- 17 period
To take long calls --- There has to be high closing candle above the 17 period moving average of highs and there has to be bullish momentum and ideally with the pivot point as a support
To take short calls -- There has to low closing candle below the 17 period moving average of lows and there has to be bearish momentum and ideally with the pivot point as a resistance.
Açık kaynak kodlu komut dosyası
Gerçek TradingView ruhuyla, bu komut dosyasının mimarı, yatırımcıların işlevselliğini inceleyip doğrulayabilmesi için onu açık kaynaklı hale getirdi. Yazarı tebrik ederiz! Ücretsiz olarak kullanabilseniz de, kodu yeniden yayınlamanın Topluluk Kurallarımıza tabi olduğunu unutmayın.
Feragatname
Bilgiler ve yayınlar, TradingView tarafından sağlanan veya onaylanan finansal, yatırım, alım satım veya diğer türden tavsiye veya öneriler anlamına gelmez ve teşkil etmez. Kullanım Koşulları bölümünde daha fazlasını okuyun.