OPEN-SOURCE SCRIPT
Price Range

Price Range
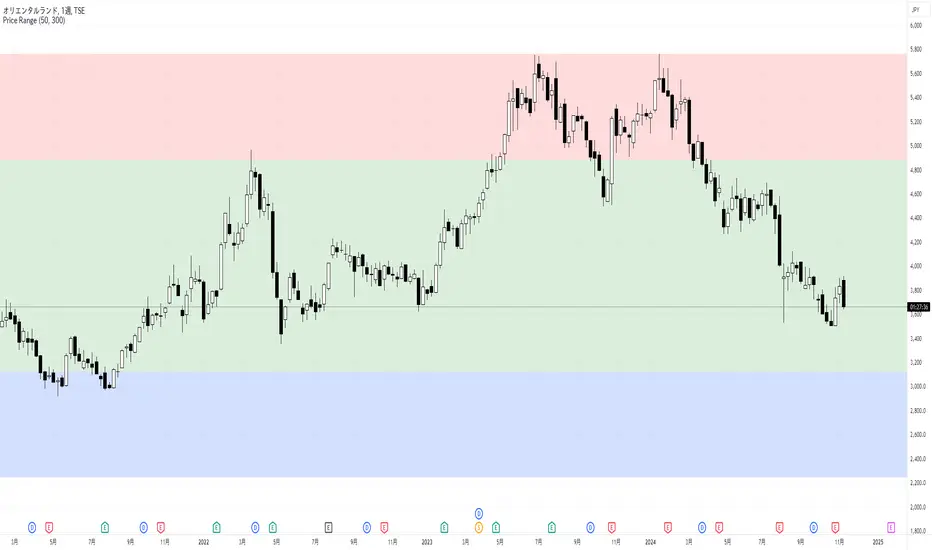
This indicator displays low, middle, and high price zones based on the lowest and highest prices over a specified period, using color-coding. This helps users visually identify the current price's position within these zones.
The effectiveness of chart patterns varies depending on where they appear within these price zones. For example, a double bottom pattern, which signals a potential market bottom, is a strong buy signal if it forms in the low zone, but it has less reliability if it forms in the middle or high zones.
Similarly, price action signals vary in significance based on their location. If a long upper wick pin bar appears in the high zone, it is often interpreted as a sign of reversal.
By combining this Price Range indicator with indicators that display chart patterns or price action signals, traders can make more informed trading decisions.
By default, the middle zone is set to cover 50% of the range, but this can be adjusted.
このインジケーターは、指定した期間の最安値と最高値をもとに、安値圏、中段圏、高値圏を色分けして表示します。これにより、ユーザーは現在の価格がどの位置にあるのかを視覚的に判断できます。
また、チャートパターンの効果は、出現する価格帯によって異なります。たとえば、ダブルボトムは相場の底を示すパターンで、安値圏で形成されると強い買いシグナルとなりますが、中段圏や高値圏で出現しても信頼性は低くなります。
プライスアクションも、どの価格帯に現れるかによって解釈が異なります。高値圏で上ヒゲの長いピンバーが現れると、反転の兆しとして判断されることが多いです。
このPrice Rangeインジケーターを、チャートパターンやプライスアクションを表示するインジケーターと組み合わせることで、より適切なトレード判断が可能になります。
デフォルトでは中段圏の割合が50%になるように設定されていますが、変更することが可能です。
Açık kaynak kodlu komut dosyası
Gerçek TradingView ruhuyla, bu komut dosyasının mimarı, yatırımcıların işlevselliğini inceleyip doğrulayabilmesi için onu açık kaynaklı hale getirdi. Yazarı tebrik ederiz! Ücretsiz olarak kullanabilseniz de, kodu yeniden yayınlamanın Topluluk Kurallarımıza tabi olduğunu unutmayın.
Feragatname
Bilgiler ve yayınlar, TradingView tarafından sağlanan veya onaylanan finansal, yatırım, alım satım veya diğer türden tavsiye veya öneriler anlamına gelmez ve teşkil etmez. Kullanım Koşulları bölümünde daha fazlasını okuyun.