rmwaddelljr

Candlestick Patterns With EMA


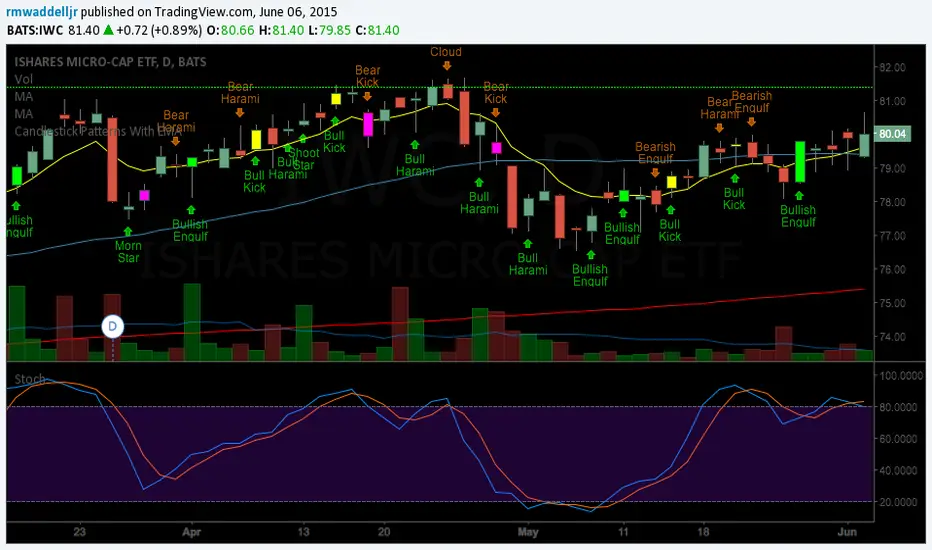
Thanks to repo32 as I embellished on his script "Candlestick patterns Identified" I also copied code ideas from DavidR
and Chris Moody. I have huge respect for you guys who publish script with such ease. My coding is a work in progress.
This script still needs improving. So let me know if you have suggestions.

The whole idea was to present these patterns in context of Steve Bigalow's work. I hope it helps in some way.
Açık kaynak kodlu komut dosyası

Gerçek TradingView ruhuyla, bu betiğin yazarı, yatırımcının anlayabilmesi ve doğrulayabilmesi için onu açık kaynak olarak yayınladı. Yazarın eline sağlık! Bunu ücretsiz olarak kullanabilirsiniz, ancak bu kodun bir yayında yeniden kullanımı Kullanım Koşulları ile yönetilir. Bir grafikte kullanmak için favorilere ekleyebilirsiniz.

Feragatname

Bilgiler ve yayınlar, TradingView tarafından sağlanan veya onaylanan finansal, yatırım, işlem veya diğer türden tavsiye veya tavsiyeler anlamına gelmez ve teşkil etmez. Kullanım Şartları'nda daha fazlasını okuyun.

Bu komut dosyasını bir grafikte kullanmak ister misiniz?
//Created by Robert Waddell with special thanks to repo32 for his cndlestick ID code, DavidR for EMA code and Chris Moody for barcolor code.
//6/5/15
//Candlestick analysis with buy signals
//If a Bullish candelstick signal is confirmed by a close above the 8 EMA, a buy signal is generated.
//If a Bearish candlestick signal is confirmed by a close below the 8 EMA, a sell signal is generated.
//Candlestick patterns are identified above or below the price action.
study(title ="Candlestick Patterns With EMA", overlay = true)
shb = input(false, title="Show Highlight Bar if close above/below TLine")


TLineEMA = input(8, minval=1, title="Trigger Line")
TLine = ema(close, TLineEMA)


ms = (close[2] < open[2] and max(open[1], close[1]) < close[2] and open > max(open[1], close[1]) and close > open )
plotshape(ms,  title= "Morning Star", location=location.belowbar, color=lime, style=shape.arrowup, offset=-1, text="Morn\nStar")


ss = (open[1] < close[1] and open > close[1] and high - max(open, close) >= abs(open - close) * 3 and min(close, open) - low <= abs(open - close))
plotshape(ss, title= "Shooting Star", location=location.belowbar, color=lime, style=shape.arrowup, text= "Shoot\nStar")


beh = (close[1] > open[1] and open > close and open <= close[1] and open[1] <= close and open - close < close[1] - open[1] )
plotshape(beh, title= "Bearish Harami",  color=orange, style=shape.arrowdown, text="Bear\nHarami")

blh = (open[1] > close[1] and close > open and close <= open[1] and close[1] <= open and close - open < open[1] - close[1] )
plotshape(blh,  title= "Bullish Harami", location=location.belowbar, color=lime, style=shape.arrowup, text="Bull\nHarami")

bee = (close[1] > open[1] and open > close and open >= close[1] and open[1] >= close and open - close > close[1] - open[1] )
plotshape(bee,  title= "Bearish Engulfing", color=orange, style=shape.arrowdown, text="Bearish\nEngulf")

ble = (open[1] > close[1] and close > open and close >= open[1] and close[1] >= open and close - open > open[1] - close[1] )
plotshape(ble, title= "Bullish Engulfing", location=location.belowbar, color=lime, style=shape.arrowup, text="Bullish\nEngulf")

upper = highest(10)[1]
ps = (close[1] < open[1] and  open < low[1] and close > close[1] + ((open[1] - close[1])/2) and close < open[1])
plotshape(ps, title= "Piercing Line", location=location.belowbar, color=lime, style=shape.arrowup, text="Pierc\nSig")

blk = (open[1]>close[1] and open>=open[1] and close>open)
plotshape(blk, title= "Bullish Kicker", location=location.belowbar, color=lime, style=shape.arrowup, text="Bull\nKick")


bek = (open[1]<close[1] and open<=open[1] and close<=open)
plotshape(bek, title= "Bearish Kicker", color=orange, style=shape.arrowdown, text="Bear\nKick")


dcc = ((close[1]>open[1])and(((close[1]+open[1])/2)>close)and(open>close)and(open>close[1])and(close>open[1])and((open-close)/(.001+(high-low))>0.6))
plotshape(dcc, title= "Dark Cloud Cover", color=orange, style=shape.arrowdown, text="Dark\nCloud")

plot(TLine, color=yellow, title="T-Line EMA", linewidth=1)

aboveTLine = close > TLine ? 1 : 0
belowTLine = close < TLine ? 1 : 0


barcolor(ms and belowTLine ? fuchsia : na)  
barcolor(bek and belowTLine ? fuchsia : na)
barcolor(ps and aboveTLine ? lime : na)
barcolor(blk and aboveTLine ? yellow : na)
barcolor(ble and aboveTLine ? lime : na)