PROTECTED SOURCE SCRIPT
VIX Index Plot with Levels
Pine Script Indicator: VIX Index Plot with Levels
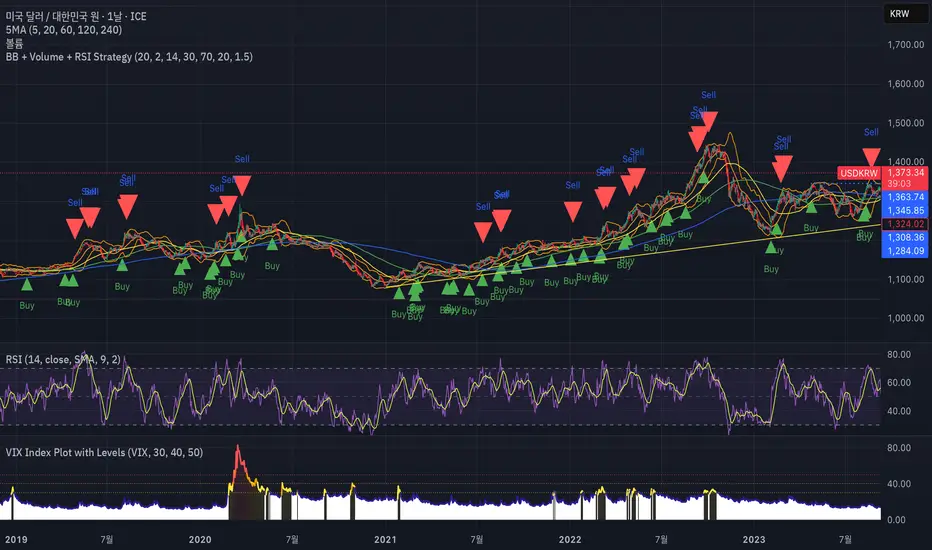
This Pine Script indicator is designed for TradingView and is specifically created to plot the VIX (Volatility Index) on a separate panel below your main price chart. Its primary goal is to visually highlight periods of heightened market fear (and potential buying opportunities) by changing the VIX line color and filling the background based on specific VIX levels.
How It Works:
VIX Data Fetching:
The script fetches the VIX index data using the request.security() function. By default, it uses the "VIX" symbol, but you can change this in the indicator's settings (e.g., to "USI:VIX" if your data provider requires it). It retrieves the closing price of VIX for each bar.
Dynamic VIX Line Coloring:
The VIX line's color dynamically changes based on its current value, providing an immediate visual cue for different levels of market volatility/fear:
Red: When VIX is at or above 50. (Indicates extreme fear)
Orange: When VIX is at or above 40 (but below 50). (Indicates high fear)
Yellow: When VIX is at or above 30 (but below 40). (Indicates elevated fear)
Navy Blue: When VIX is below 30. (Indicates normal to low volatility)
Horizontal Level Lines:
Dotted horizontal lines are plotted at the 30, 40, and 50 VIX levels. These serve as clear visual markers, helping you quickly identify when VIX crosses these important thresholds. The color of these lines matches the corresponding emphasis color (yellow, orange, red).
Background Fill for Emphasis:
To further enhance visual clarity, the area below the VIX line (down to the 0-level of the VIX panel) is filled with a color corresponding to the current VIX level. This creates a prominent colored band that highlights periods of elevated fear:
Red Fill: When VIX is 50 or above.
Orange Fill: When VIX is 40 or above (but below 50).
Yellow Fill: When VIX is 30 or above (but below 40).
The fill has a slight transparency (90%) to remain subtle yet effective.
Customization:
You can easily adjust the parameters of this indicator by accessing its settings on your TradingView chart. Look for the gear icon next to the indicator name on your chart to modify:
VIX Symbol: Change the VIX symbol if needed (e.g., "VIX", "USI:VIX").
VIX Level 1 (Yellow): Adjust the threshold for the yellow emphasis (default: 30.0).
VIX Level 2 (Orange): Adjust the threshold for the orange emphasis (default: 40.0).
VIX Level 3 (Red): Adjust the threshold for the red emphasis (default: 50.0).
How to Use This Script in TradingView:
Open your TradingView chart.
Go to the "Pine Editor" tab at the bottom.
Delete any existing code in the editor (if you are replacing a previous VIX script).
Copy and paste the entire provided Pine Script code into the Pine Editor.
Click "Add to Chart" (or "Save" and then "Add to Chart").
This indicator will appear as a separate panel below your main price chart, providing you with a dynamic and intuitive visual representation of market volatility based on VIX levels. This can be a valuable tool for identifying potential market bottoms during periods of high fear.
Korumalı komut dosyası
Bu komut dosyası kapalı kaynak olarak yayınlanmaktadır. Ancak, ücretsiz ve herhangi bir sınırlama olmaksızın kullanabilirsiniz – daha fazla bilgiyi buradan edinebilirsiniz.
Feragatname
Bilgiler ve yayınlar, TradingView tarafından sağlanan veya onaylanan finansal, yatırım, alım satım veya diğer türden tavsiye veya öneriler anlamına gelmez ve teşkil etmez. Kullanım Koşulları bölümünde daha fazlasını okuyun.