CAD Data
We're excited to release a significant update to the CAD Data indicator that introduces visual target lines and comprehensive backtesting data.
What's New
1. Visual Target Lines on Chart
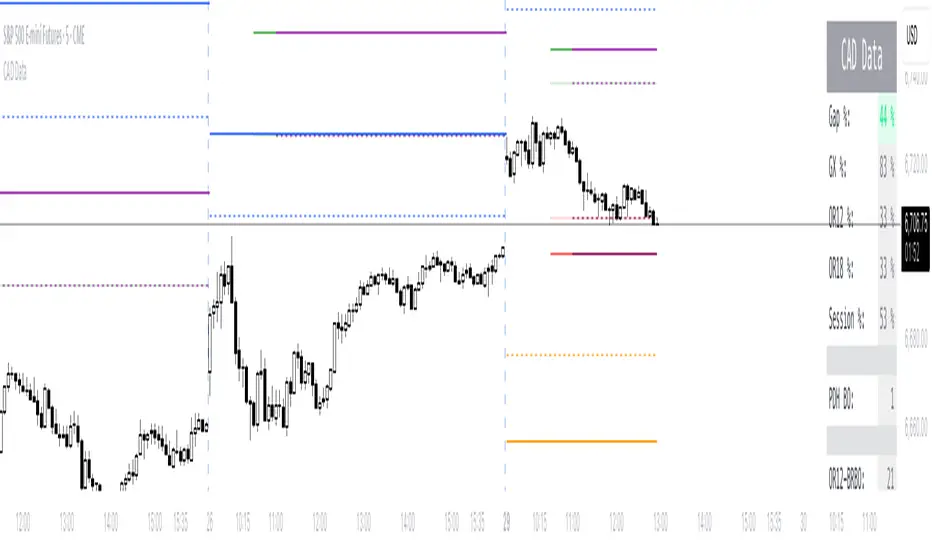
The indicator now displays measured move target lines directly on your charts for three key opening range periods:
- OR12 Targets (First 12 bars): 50% and 100% measured move targets with bullish (above range) and bearish (below range) projections
- OR18 Targets (First 18 bars): 50% and 100% measured move targets for extended range analysis
- Globex/Pre-market Targets: 50% and 100% targets based on overnight/pre-market range
2. Fully Customizable Line Appearance
Each target line set offers complete visual customization:
- Colors: Choose distinct colors for bullish/bearish and 50%/100% levels
- Line Styles: Solid, Dashed, or Dotted options
- Line Width: Adjustable thickness (1-4)
- Toggle Display: Show/hide each target set independently
3. Comprehensive Data Window for Backtesting
The Data Window now includes 38 critical metrics organized into 7 sections:
- Session Statistics: Gap %, GX Range %, OR12 Range %, OR18 Range %, Current Session %
- Breakout Detection: Gap Close Bar, PDH/PDL Breakout Bars, GXH/GXL Breakout Bars
- OR12 Target Hits: Bull/Bear Breakout Bars, 50% and 100% Target Hit Bars
- OR18 Target Hits: Bull/Bear Breakout Bars, 50% and 100% Target Hit Bars
- Globex Target Hits: 50% and 100% Bull/Bear Target Hit Bars
- Directional Indicators: OR Close vs Previous Day/Globex/Open
- EMA Analysis: Closes Above/Below EMA counts
Use Cases
For Day Traders:
- Identify key measured move targets for the trading session
- Track when price hits statistical profit targets
- Monitor opening range breakout confirmations
For Systematic Traders:
- Access complete bar-by-bar data for strategy development
- Backtest measured move strategies with precise target hit timing
- Analyze opening range dynamics across different timeframes
How to Use
1. Enable Target Lines: Use the "Target Lines" settings group to show/hide each target set
2. Customize Appearance: Adjust colors, styles, and widths in the respective settings groups (OR12, OR18, Globex)
3. Access Data Window: Open TradingView's Data Window (right sidebar) to view all metrics
4. Export for Analysis: Data Window values can be copied for external analysis and backtesting
Notes
- Target lines are calculated after their respective periods complete (bar 13 for OR12, bar 19 for OR18)
- Lines extend through the trading session and lock at session close
- All calculations reset each trading day
- Data Window metrics use 0 for events that haven't occurred, and the bar number when they do occur
Thank you for your continued support. Happy trading!
Yalnızca davetli komut dosyası
Bu komut dosyasına yalnızca yazar tarafından onaylanan kullanıcılar erişebilir. Kullanmak için izin istemeniz ve almanız gerekir. Bu genellikle ödeme yapıldıktan sonra verilir. Daha fazla ayrıntı için aşağıdaki yazarın talimatlarını izleyin veya doğrudan JR_PA ile iletişime geçin.
TradingView, yazarına tamamen güvenmediğiniz ve nasıl çalıştığını anlamadığınız sürece bir komut dosyası için ödeme yapmanızı veya kullanmanızı TAVSİYE ETMEZ. Ayrıca topluluk komut dosyalarımızda ücretsiz, açık kaynaklı alternatifler bulabilirsiniz.
Yazarın talimatları
Feragatname
Yalnızca davetli komut dosyası
Bu komut dosyasına yalnızca yazar tarafından onaylanan kullanıcılar erişebilir. Kullanmak için izin istemeniz ve almanız gerekir. Bu genellikle ödeme yapıldıktan sonra verilir. Daha fazla ayrıntı için aşağıdaki yazarın talimatlarını izleyin veya doğrudan JR_PA ile iletişime geçin.
TradingView, yazarına tamamen güvenmediğiniz ve nasıl çalıştığını anlamadığınız sürece bir komut dosyası için ödeme yapmanızı veya kullanmanızı TAVSİYE ETMEZ. Ayrıca topluluk komut dosyalarımızda ücretsiz, açık kaynaklı alternatifler bulabilirsiniz.