OPEN-SOURCE SCRIPT
Güncellendi Market Inner Strength Index

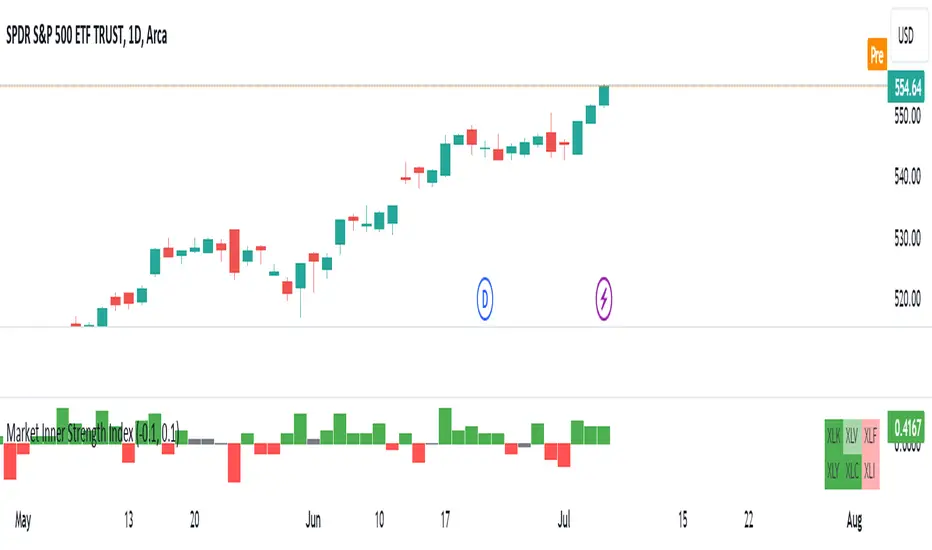
The "Market Inner Strength Index" is an indicator designed to visually represent the market strength by analyzing the six major sectors: XLK, XLV, XLF, XLY, XLC and XLI. These sectors represent more than 80% of the SPX index, making their performance crucial for understanding overall market conditions. The indicator calculates the individual strengths of these sectors and combines them to provide an overall market strength index, helping to identify scenarios of sector rotation, euphoria, or panic.
Rationale:
The six major sectors (XLK, XLV, XLF, XLY, XLC, XLI) are essential as they encompass a significant portion of the SPX index. Typically, money rotates among these sectors, meaning some sectors grow while others decline. Rare occasions where all sectors move in the same direction can indicate market-wide euphoria (upwards) or panic (downwards). The Market Inner Strength Index helps track sector performance and identify these scenarios.
Methodology:
Script requests current timeframe data for each of the sectors and assigns scores, based on its performance. It will work best on the daily and higher timeframes but can also be used on the lower timeframes.
Score assignment:
The scores for the six sectors are averaged to compute a total score, which is plotted on the chart. A table displays the performance of each sector, color-coded based on their scores for the last period.
Parameters:
Neutral Zone: Define the neutral zone threshold.
Heikin Ashi: Option to use Heikin Ashi candles instead of normal ones.
Show Divergency: Option to show divergences on the chart. Divergence occurs when the SPY is bullish, but the sector score is bearish, or vice versa. This option will only work on SPY chart.
Sector selections: Enable/disable specific sectors in score calculation.
Rationale:
The six major sectors (XLK, XLV, XLF, XLY, XLC, XLI) are essential as they encompass a significant portion of the SPX index. Typically, money rotates among these sectors, meaning some sectors grow while others decline. Rare occasions where all sectors move in the same direction can indicate market-wide euphoria (upwards) or panic (downwards). The Market Inner Strength Index helps track sector performance and identify these scenarios.
Methodology:
Script requests current timeframe data for each of the sectors and assigns scores, based on its performance. It will work best on the daily and higher timeframes but can also be used on the lower timeframes.
Score assignment:
- If the sector is green (positive performance) for the given timeframe, it receives positive points.
- If the sector is red (negative performance), it receives negative points.
- If the current close price is above the previous period high, additional positive points are assigned.
- If the current close price is below the previous period low, additional negative points are assigned.
The scores for the six sectors are averaged to compute a total score, which is plotted on the chart. A table displays the performance of each sector, color-coded based on their scores for the last period.
Parameters:
Neutral Zone: Define the neutral zone threshold.
Heikin Ashi: Option to use Heikin Ashi candles instead of normal ones.
Show Divergency: Option to show divergences on the chart. Divergence occurs when the SPY is bullish, but the sector score is bearish, or vice versa. This option will only work on SPY chart.
Sector selections: Enable/disable specific sectors in score calculation.
Sürüm Notları
UPD 1.1: added dividends adjustment Sürüm Notları
UPD 1.2: This update adds an additional dimension: whether the strength or weakness is driven by growth (risk-on) sectors such as XLK and XLY. These growth sectors often serve as 'canaries in the coal mine,' reflecting investors' enthusiasm or fear. Observing the strength or weakness in these sectors can provide further confirmation of broader market sentiment. You can switch on/off this feature in the settings.
Açık kaynak kodlu komut dosyası
Gerçek TradingView ruhuyla, bu komut dosyasının mimarı, yatırımcıların işlevselliğini inceleyip doğrulayabilmesi için onu açık kaynaklı hale getirdi. Yazarı tebrik ederiz! Ücretsiz olarak kullanabilseniz de, kodu yeniden yayınlamanın Topluluk Kurallarımıza tabi olduğunu unutmayın.
Feragatname
Bilgiler ve yayınlar, TradingView tarafından sağlanan veya onaylanan finansal, yatırım, alım satım veya diğer türden tavsiye veya öneriler anlamına gelmez ve teşkil etmez. Kullanım Koşulları bölümünde daha fazlasını okuyun.