OPEN-SOURCE SCRIPT
Güncellendi Buy/Sell Alert EMA with SuperFormula by zdmre
*** Use it at your own risk
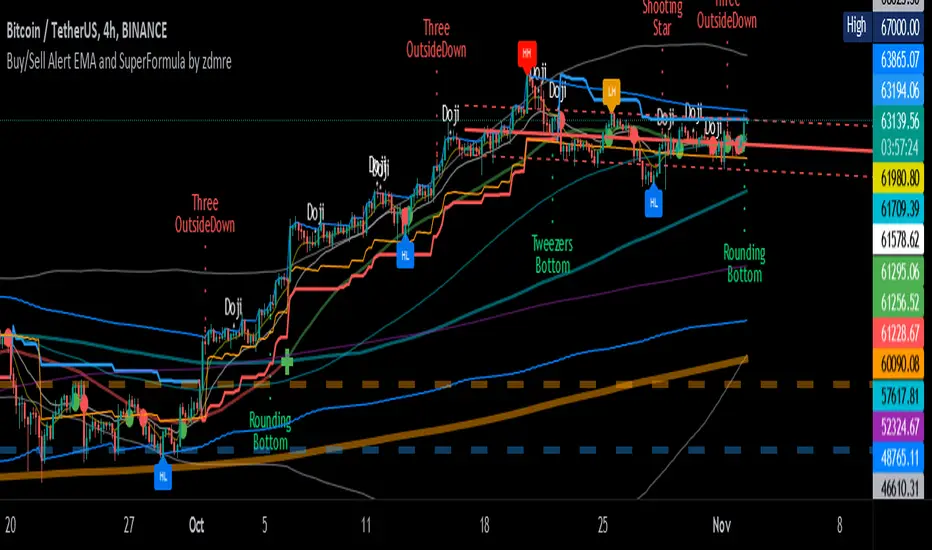
This indicator has 3 indicators and gives a buy/sell signal depending on the EMA.
3 indicators:
It also shows the value on the candle as a warning in the Buy and Sell signals. This value is calculated with a special formula I have created.
On the other hand Bollinger Band and Ichimoku Cloud are also included to check the accuracy of the signals.
For this indicator, I recommend a minimum of 4 hours chart.
This indicator has 3 indicators and gives a buy/sell signal depending on the EMA.
3 indicators:
- - Ichimoku
- - Bollinger Band
- - EMA
It also shows the value on the candle as a warning in the Buy and Sell signals. This value is calculated with a special formula I have created.
On the other hand Bollinger Band and Ichimoku Cloud are also included to check the accuracy of the signals.
For this indicator, I recommend a minimum of 4 hours chart.
Sürüm Notları
v 2.0-adding THEIL-SEN ESTIMATOR @tbiktag (Thanks my friend)
-changing default EMA values to 8-20
Sürüm Notları
Release Notes: v 3.0-Adding Bitcoin Investor Tool: 2-Year MA Multiplier + 1-Year MA
-Adding Pi Cycle Top Indicator
Sürüm Notları
Release Notes: Release Notes: v 4.0-Adding KAMA Indicator
-Adding Cup Indicator
Sürüm Notları
Max bar problem fixed.Trailing Stop Loss improved.
"Show Buy/Sell Signals" added. Default value=true
"Show Calculation Values" added. Default value=false
Sürüm Notları
Improved RSI, Sell Point, Calc Value Label.Added "Show TrailingSTOP Prices" label.
Sürüm Notları
Updated PineScript version 5Added Pattern Trend Calculations (Fibonacci, RSI, DMI)
Added Flagging
Added ZigZag (HH-HL-LH-LL)
Added Tables
Added Advanced Patterns
and more
Sürüm Notları
Removed KAMA,Removed Cup,
Removed Pattern Trend Calculations (Fibonacci, RSI, DMI)
Removed Tables,
Added Advanced Patterns
Added Cup and Handle.
Optimization and Visual improvements.
Sürüm Notları
Bug fixes.Açık kaynak kodlu komut dosyası
Gerçek TradingView ruhuyla, bu komut dosyasının yaratıcısı, yatırımcıların işlevselliğini inceleyip doğrulayabilmesi için onu açık kaynaklı hale getirdi. Yazarı tebrik ederiz! Ücretsiz olarak kullanabilseniz de, kodu yeniden yayınlamanın Topluluk Kurallarımıza tabi olduğunu unutmayın.
Feragatname
Bilgiler ve yayınlar, TradingView tarafından sağlanan veya onaylanan finansal, yatırım, alım satım veya diğer türden tavsiye veya öneriler anlamına gelmez ve teşkil etmez. Kullanım Koşulları bölümünde daha fazlasını okuyun.
Açık kaynak kodlu komut dosyası
Gerçek TradingView ruhuyla, bu komut dosyasının yaratıcısı, yatırımcıların işlevselliğini inceleyip doğrulayabilmesi için onu açık kaynaklı hale getirdi. Yazarı tebrik ederiz! Ücretsiz olarak kullanabilseniz de, kodu yeniden yayınlamanın Topluluk Kurallarımıza tabi olduğunu unutmayın.
Feragatname
Bilgiler ve yayınlar, TradingView tarafından sağlanan veya onaylanan finansal, yatırım, alım satım veya diğer türden tavsiye veya öneriler anlamına gelmez ve teşkil etmez. Kullanım Koşulları bölümünde daha fazlasını okuyun.