PROTECTED SOURCE SCRIPT
SPPO - Statistical Price Position Oscillator
SPPO - Statistical Price Position Oscillator - Time-Weighted
[Core Function]
Based on a time-weighted statistical model, this indicator quantifies price deviation from its recent mean. It uses a Z-Score to normalize price position and calculates the statistical probability of its occurrence, helping traders identify over-extended market conditions and mean-reversion opportunities with greater sensitivity.
[Unique Advantages]
- Time-Weighted Model: Reacts more quickly to recent price changes by using a Weighted Moving Average (WMA) and a weighted standard deviation.
- Statistical Foundation: Utilizes Z-Score standardization and a probability calculation to provide an objective measure of risk and price extremity.
- Dynamic Adaptation: Automatically adjusts its calculation period and sensitivity based on market volatility, making it versatile across different market conditions.
- Intelligent Visuals: Dynamic line thickness and gradient color-coding intuitively display the intensity of price deviations.
- Multi-Dimensional Analysis: Combines the main line's position (Z-Score), a momentum histogram, and real-time probability for a comprehensive view.
[Technical Principles]
1. Time-Weighted Statistical Model (Z-Score Calculation)
- Weighted Mean (μ_w): Instead of a simple average, the indicator uses a Weighted Moving Average (ta.wma) to calculate the price mean, giving more weight to recent data points.
- Weighted Standard Deviation (σ_w): A custom weighted_std function calculates the standard deviation, also prioritizing recent prices. This ensures that the measure of dispersion is more responsive to the latest market behavior.
- Z-Score: The core of the indicator is the Z-Score, calculated as Z = (Price - μ_w) / σ_w. This value represents how many weighted standard deviations the current price is from its weighted mean. A higher absolute Z-Score indicates a more statistically significant price deviation.
2. Probability Calculation
- The indicator uses an approximation of the Normal Cumulative Distribution Function (normal_cdf_approx) to calculate the probability of a Z-Score occurring.
- The final price_probability is a two-tailed probability, calculated as 2 * (1 - CDF(|Z-Score|)). This value quantifies the statistical rarity of the current price deviation. For example, a probability of 0.05 (or 5%) means that a deviation of this magnitude or greater is expected to occur only 5% of the time, signaling a potential market extreme.
3. Dynamic Parameter Adjustment
- Volatility Measurement: The system measures market volatility using the standard deviation of price changes (ta.stdev(ta.change(src))) over a specific lookback period.
- Volatility Percentile: It then calculates the percentile rank (ta.percentrank) of the current volatility relative to its history. This contextualizes whether the market is in a high-volatility or low-volatility state.
- Adaptive Adjustment:
- If volatility is high (e.g., >75th percentile), the indicator can shorten its distribution_period and increase its position_sensitivity. This makes it more responsive to fast-moving markets.
- If volatility is low (e.g., <25th percentile), it can lengthen the period and decrease sensitivity, making it more stable in calmer markets. This adaptive mechanism helps maintain the indicator's relevance across different market regimes.
4. Momentum and Cycle Analysis (Histogram)
- The indicator does not use a Hilbert Transform. Instead, it analyzes momentum cycles by calculating a histogram: Histogram = (Z-Score - EMA(Z-Score)) * Sensitivity.
- This histogram represents the rate of change of the Z-Score. A positive and rising histogram indicates accelerating upward deviation, while a negative and falling histogram indicates accelerating downward deviation. Divergences between the price and the histogram can signal a potential exhaustion of the current deviation trend, often preceding a reversal.
[How to Use]
- Reversal Signals: Look for the main line in extreme zones (e.g., Z-Score > 2 or < -2), probability below a threshold (e.g., 5%), and divergence or contraction in the momentum histogram.
- Trend Filtering: The main line's direction indicates the trend of price deviation, while the histogram confirms its momentum.
- Risk Management: Enter a high-alert state when probability drops below 5%; consider risk control when |Z-Score| > 2.
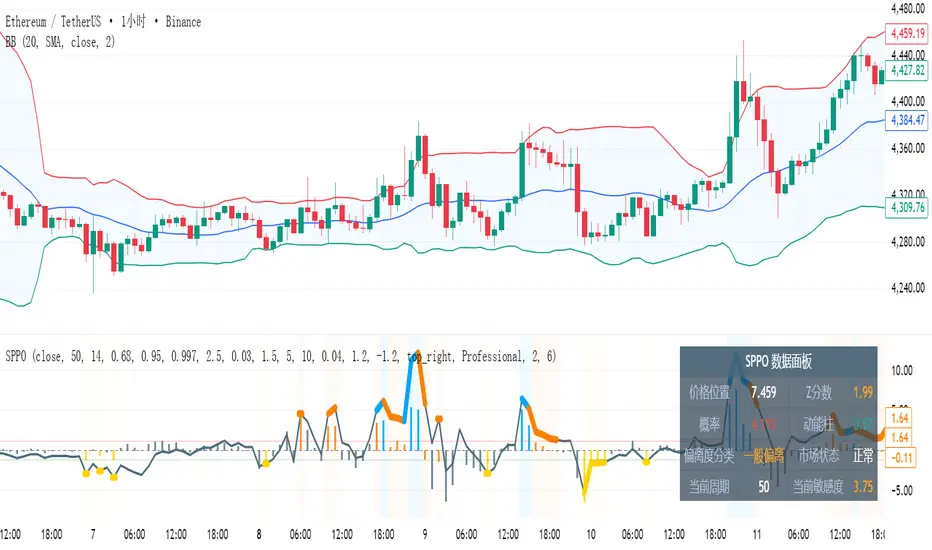
[Visual System]
- Gray, thin line: Price is within a normal statistical range (~1 sigma, ~68% probability).
- Orange/Yellow, thick line: Price is moderately deviated (1 to 2 sigma).
- Cyan/Purple, thick line: Price is extremely deviated (>2 sigma, typically <5% probability).
[Default Parameters]
- Distribution Period: 50 (for weighted calculation)
- Position Sensitivity: 2.5
- Volatility Lookback: 10
- Probability Threshold: 0.03
[Applicability]
Suitable for all financial markets and timeframes, especially in markets that exhibit mean-reverting tendencies.
[Risk Disclaimer]
This indicator is a technical analysis tool and does not constitute investment advice. Always use in conjunction with other analysis methods and a strict risk management strategy.
Copyright (c) 2025 | Pine Script v6 Compatible
---
统计价格位置振荡器 (SPPO) - 时间加权版
[核心功能]
基于时间加权统计学模型,该指标量化了当前价格与其近期均值的偏离程度。它使用Z分数对价格位置进行标准化,并计算其出现的统计概率,帮助交易者更灵敏地识别市场过度延伸和均值回归的机会。
[独特优势]
- 时间加权模型:通过使用加权移动平均(WMA)和加权标准差,对近期价格变化反应更迅速。
- 统计学基础:利用Z分数标准化和概率计算,为风险和价格极端性提供了客观的衡量标准。
- 动态自适应:根据市场波动率自动调整其计算周期和敏感度,使其在不同市场条件下都具有通用性。
- 智能视觉:动态线条粗细和渐变颜色编码,直观地展示价格偏离的强度。
- 多维分析:结合了主线位置(Z分数)、动能柱和实时概率,提供了全面的市场视角。
[技术原理]
1. 时间加权统计模型 (Z分数计算)
- 加权均值 (μ_w):指标使用加权移动平均 (ta.wma) 而非简单平均来计算价格均值,赋予近期数据点更高的权重。
- 加权标准差 (σ_w):通过一个自定义的 weighted_std 函数计算标准差,同样优先考虑近期价格。这确保了离散度的衡量对最新的市场行为更敏感。
- Z分数:指标的核心是Z分数,计算公式为 Z = (价格 - μ_w) / σ_w。该值表示当前价格偏离其加权均值的加权标准差倍数。Z分数的绝对值越高,表示价格偏离在统计上越显著。
2. 概率计算
- 指标使用正态累积分布函数 (normal_cdf_approx) 的近似值来计算特定Z分数出现的概率。
- 最终的 price_probability 是一个双尾概率,计算公式为 2 * (1 - CDF(|Z分数|))。该值量化了当前价格偏离的统计稀有性。例如,0.05(或5%)的概率意味着这种幅度或更大的偏离预计只在5%的时间内发生,这预示着一个潜在的市场极端。
3. 动态参数调整
- 波动率测量:系统通过计算特定回溯期内价格变化的标准差 (ta.stdev(ta.change(src))) 来测量市场波动率。
- 波动率百分位:然后,它计算当前波动率相对于其历史的百分位排名 (ta.percentrank)。这将当前市场背景定义为高波动率或低波动率状态。
- 自适应调整:
- 如果波动率高(例如,>75百分位),指标可以缩短其 distribution_period(分布周期)并增加其 position_sensitivity(位置敏感度),使其对快速变化的市场反应更灵敏。
- 如果波动率低(例如,<25百分位),它可以延长周期并降低敏感度,使其在较平静的市场中更稳定。这种自适应机制有助于保持指标在不同市场制度下的有效性。
4. 动能与周期分析 (动能柱)
- 该指标不使用希尔伯特变换。相反,它通过计算一个动能柱来分析动量周期:动能柱 = (Z分数 - Z分数的EMA) * 敏感度。
- 该动能柱代表Z分数的变化率。一个正向且不断增长的动能柱表示向上的偏离正在加速,而一个负向且不断下降的动能柱表示向下的偏离正在加速。价格与动能柱之间的背离可以预示当前偏离趋势的衰竭,通常发生在反转之前。
[使用方法]
- 反转信号:寻找主线进入极端区域(如Z分数 > 2 或 < -2)、概率低于阈值(如5%)以及动能柱出现背离或收缩。
- 趋势过滤:主线的方向指示价格偏离的趋势,而动能柱确认其动量。
- 风险管理:当概率降至5%以下时进入高度警惕状态;当|Z分数| > 2时考虑风险控制。
[视觉系统]
- 灰色细线:价格处于正常统计范围内(约1个标准差,约68%概率)。
- 橙色/黄色粗线:价格中度偏离(1到2个标准差)。
- 青色/紫色粗线:价格极端偏离(>2个标准差,通常概率<5%)。
[默认参数]
- 分布周期:50(用于加权计算)
- 位置敏感度:2.5
- 波动率回溯期:10
- 概率阈值:0.03
[适用范围]
适用于所有金融市场和时间框架,尤其是在表现出均值回归特性的市场中。
[风险提示]
本指标为技术分析辅助工具,不构成任何投资建议。请务必结合其他分析方法和严格的风险管理策略使用。
版权所有 (c) 2025 | Pine Script v6 兼容
[Core Function]
Based on a time-weighted statistical model, this indicator quantifies price deviation from its recent mean. It uses a Z-Score to normalize price position and calculates the statistical probability of its occurrence, helping traders identify over-extended market conditions and mean-reversion opportunities with greater sensitivity.
[Unique Advantages]
- Time-Weighted Model: Reacts more quickly to recent price changes by using a Weighted Moving Average (WMA) and a weighted standard deviation.
- Statistical Foundation: Utilizes Z-Score standardization and a probability calculation to provide an objective measure of risk and price extremity.
- Dynamic Adaptation: Automatically adjusts its calculation period and sensitivity based on market volatility, making it versatile across different market conditions.
- Intelligent Visuals: Dynamic line thickness and gradient color-coding intuitively display the intensity of price deviations.
- Multi-Dimensional Analysis: Combines the main line's position (Z-Score), a momentum histogram, and real-time probability for a comprehensive view.
[Technical Principles]
1. Time-Weighted Statistical Model (Z-Score Calculation)
- Weighted Mean (μ_w): Instead of a simple average, the indicator uses a Weighted Moving Average (ta.wma) to calculate the price mean, giving more weight to recent data points.
- Weighted Standard Deviation (σ_w): A custom weighted_std function calculates the standard deviation, also prioritizing recent prices. This ensures that the measure of dispersion is more responsive to the latest market behavior.
- Z-Score: The core of the indicator is the Z-Score, calculated as Z = (Price - μ_w) / σ_w. This value represents how many weighted standard deviations the current price is from its weighted mean. A higher absolute Z-Score indicates a more statistically significant price deviation.
2. Probability Calculation
- The indicator uses an approximation of the Normal Cumulative Distribution Function (normal_cdf_approx) to calculate the probability of a Z-Score occurring.
- The final price_probability is a two-tailed probability, calculated as 2 * (1 - CDF(|Z-Score|)). This value quantifies the statistical rarity of the current price deviation. For example, a probability of 0.05 (or 5%) means that a deviation of this magnitude or greater is expected to occur only 5% of the time, signaling a potential market extreme.
3. Dynamic Parameter Adjustment
- Volatility Measurement: The system measures market volatility using the standard deviation of price changes (ta.stdev(ta.change(src))) over a specific lookback period.
- Volatility Percentile: It then calculates the percentile rank (ta.percentrank) of the current volatility relative to its history. This contextualizes whether the market is in a high-volatility or low-volatility state.
- Adaptive Adjustment:
- If volatility is high (e.g., >75th percentile), the indicator can shorten its distribution_period and increase its position_sensitivity. This makes it more responsive to fast-moving markets.
- If volatility is low (e.g., <25th percentile), it can lengthen the period and decrease sensitivity, making it more stable in calmer markets. This adaptive mechanism helps maintain the indicator's relevance across different market regimes.
4. Momentum and Cycle Analysis (Histogram)
- The indicator does not use a Hilbert Transform. Instead, it analyzes momentum cycles by calculating a histogram: Histogram = (Z-Score - EMA(Z-Score)) * Sensitivity.
- This histogram represents the rate of change of the Z-Score. A positive and rising histogram indicates accelerating upward deviation, while a negative and falling histogram indicates accelerating downward deviation. Divergences between the price and the histogram can signal a potential exhaustion of the current deviation trend, often preceding a reversal.
[How to Use]
- Reversal Signals: Look for the main line in extreme zones (e.g., Z-Score > 2 or < -2), probability below a threshold (e.g., 5%), and divergence or contraction in the momentum histogram.
- Trend Filtering: The main line's direction indicates the trend of price deviation, while the histogram confirms its momentum.
- Risk Management: Enter a high-alert state when probability drops below 5%; consider risk control when |Z-Score| > 2.
[Visual System]
- Gray, thin line: Price is within a normal statistical range (~1 sigma, ~68% probability).
- Orange/Yellow, thick line: Price is moderately deviated (1 to 2 sigma).
- Cyan/Purple, thick line: Price is extremely deviated (>2 sigma, typically <5% probability).
[Default Parameters]
- Distribution Period: 50 (for weighted calculation)
- Position Sensitivity: 2.5
- Volatility Lookback: 10
- Probability Threshold: 0.03
[Applicability]
Suitable for all financial markets and timeframes, especially in markets that exhibit mean-reverting tendencies.
[Risk Disclaimer]
This indicator is a technical analysis tool and does not constitute investment advice. Always use in conjunction with other analysis methods and a strict risk management strategy.
Copyright (c) 2025 | Pine Script v6 Compatible
---
统计价格位置振荡器 (SPPO) - 时间加权版
[核心功能]
基于时间加权统计学模型,该指标量化了当前价格与其近期均值的偏离程度。它使用Z分数对价格位置进行标准化,并计算其出现的统计概率,帮助交易者更灵敏地识别市场过度延伸和均值回归的机会。
[独特优势]
- 时间加权模型:通过使用加权移动平均(WMA)和加权标准差,对近期价格变化反应更迅速。
- 统计学基础:利用Z分数标准化和概率计算,为风险和价格极端性提供了客观的衡量标准。
- 动态自适应:根据市场波动率自动调整其计算周期和敏感度,使其在不同市场条件下都具有通用性。
- 智能视觉:动态线条粗细和渐变颜色编码,直观地展示价格偏离的强度。
- 多维分析:结合了主线位置(Z分数)、动能柱和实时概率,提供了全面的市场视角。
[技术原理]
1. 时间加权统计模型 (Z分数计算)
- 加权均值 (μ_w):指标使用加权移动平均 (ta.wma) 而非简单平均来计算价格均值,赋予近期数据点更高的权重。
- 加权标准差 (σ_w):通过一个自定义的 weighted_std 函数计算标准差,同样优先考虑近期价格。这确保了离散度的衡量对最新的市场行为更敏感。
- Z分数:指标的核心是Z分数,计算公式为 Z = (价格 - μ_w) / σ_w。该值表示当前价格偏离其加权均值的加权标准差倍数。Z分数的绝对值越高,表示价格偏离在统计上越显著。
2. 概率计算
- 指标使用正态累积分布函数 (normal_cdf_approx) 的近似值来计算特定Z分数出现的概率。
- 最终的 price_probability 是一个双尾概率,计算公式为 2 * (1 - CDF(|Z分数|))。该值量化了当前价格偏离的统计稀有性。例如,0.05(或5%)的概率意味着这种幅度或更大的偏离预计只在5%的时间内发生,这预示着一个潜在的市场极端。
3. 动态参数调整
- 波动率测量:系统通过计算特定回溯期内价格变化的标准差 (ta.stdev(ta.change(src))) 来测量市场波动率。
- 波动率百分位:然后,它计算当前波动率相对于其历史的百分位排名 (ta.percentrank)。这将当前市场背景定义为高波动率或低波动率状态。
- 自适应调整:
- 如果波动率高(例如,>75百分位),指标可以缩短其 distribution_period(分布周期)并增加其 position_sensitivity(位置敏感度),使其对快速变化的市场反应更灵敏。
- 如果波动率低(例如,<25百分位),它可以延长周期并降低敏感度,使其在较平静的市场中更稳定。这种自适应机制有助于保持指标在不同市场制度下的有效性。
4. 动能与周期分析 (动能柱)
- 该指标不使用希尔伯特变换。相反,它通过计算一个动能柱来分析动量周期:动能柱 = (Z分数 - Z分数的EMA) * 敏感度。
- 该动能柱代表Z分数的变化率。一个正向且不断增长的动能柱表示向上的偏离正在加速,而一个负向且不断下降的动能柱表示向下的偏离正在加速。价格与动能柱之间的背离可以预示当前偏离趋势的衰竭,通常发生在反转之前。
[使用方法]
- 反转信号:寻找主线进入极端区域(如Z分数 > 2 或 < -2)、概率低于阈值(如5%)以及动能柱出现背离或收缩。
- 趋势过滤:主线的方向指示价格偏离的趋势,而动能柱确认其动量。
- 风险管理:当概率降至5%以下时进入高度警惕状态;当|Z分数| > 2时考虑风险控制。
[视觉系统]
- 灰色细线:价格处于正常统计范围内(约1个标准差,约68%概率)。
- 橙色/黄色粗线:价格中度偏离(1到2个标准差)。
- 青色/紫色粗线:价格极端偏离(>2个标准差,通常概率<5%)。
[默认参数]
- 分布周期:50(用于加权计算)
- 位置敏感度:2.5
- 波动率回溯期:10
- 概率阈值:0.03
[适用范围]
适用于所有金融市场和时间框架,尤其是在表现出均值回归特性的市场中。
[风险提示]
本指标为技术分析辅助工具,不构成任何投资建议。请务必结合其他分析方法和严格的风险管理策略使用。
版权所有 (c) 2025 | Pine Script v6 兼容
Korumalı komut dosyası
Bu komut dosyası kapalı kaynak olarak yayınlanmaktadır. Ancak, ücretsiz ve herhangi bir sınırlama olmaksızın kullanabilirsiniz – daha fazla bilgiyi buradan edinebilirsiniz.
Feragatname
Bilgiler ve yayınlar, TradingView tarafından sağlanan veya onaylanan finansal, yatırım, alım satım veya diğer türden tavsiye veya öneriler anlamına gelmez ve teşkil etmez. Kullanım Koşulları bölümünde daha fazlasını okuyun.