PROTECTED SOURCE SCRIPT
Momentum Phases

📌 Overview
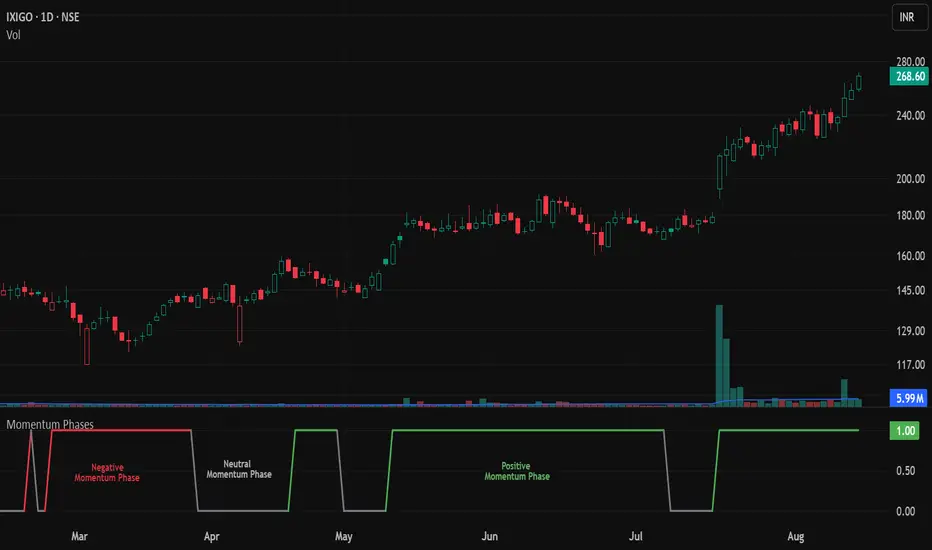
The Momentum Phases indicator helps traders quickly identify periods of strong bullish or bearish momentum based on the relationship between a short‑term and a long‑term Moving Average (SMA).
It helps traders visually distinguish between Positive 🟢, Negative 🔴, and Neutral ⚪ phases by plotting a dynamically colored state line and generating optional alerts when a phase change occurs.
🧠 How It Works
⦿ SMA Calculation
Pine Script®
⦿ Momentum Ratio
Pine Script®
⦿ Threshold Levels
⦿ Momentum States
⦿ State Line Plot
📈 How to Use
⚙️ Customization
🔔 Alerts
🎯 Add this indicator to your chart to track momentum phases like a pro — know exactly when trends start, end, or stall.
The Momentum Phases indicator helps traders quickly identify periods of strong bullish or bearish momentum based on the relationship between a short‑term and a long‑term Moving Average (SMA).
It helps traders visually distinguish between Positive 🟢, Negative 🔴, and Neutral ⚪ phases by plotting a dynamically colored state line and generating optional alerts when a phase change occurs.
🧠 How It Works
⦿ SMA Calculation
- The indicator calculates two SMAs:
- Short SMA (default: 7 periods)
- Long SMA (default: 65 periods)
- Both SMA lengths can be adjusted by the user.
// SMA calculations
smaShort = ta.sma(close, shortLen)
smaLong = ta.sma(close, longLen)
⦿ Momentum Ratio
- A ratio is calculated:
ratio = smaShort / smaLong
- This ratio measures how far the short‑term trend has diverged from the long‑term trend.
⦿ Threshold Levels
- Positive Threshold (default: 1.05) — indicates short SMA is at least 5% above the long SMA.
- Negative Threshold (default: 0.95) — indicates short SMA is at least 5% below the long SMA.
- These thresholds are user‑adjustable.
⦿ Momentum States
- Positive Momentum: Ratio ≥ Positive Threshold (default: 1.05) → Short SMA is at least 5% above Long SMA.
- Negative Momentum: Ratio ≤ Negative Threshold (default: 0.95) → Short SMA is at least 5% below Long SMA.
- Neutral: Ratio between the two thresholds.
⦿ State Line Plot
- The indicator plots a flat state line at 1.0 when in positive or negative momentum, and 0.0 when in neutral.
- The state line’s color changes dynamically:
- Green 🟢 Positive Momentum: Ratio ≥ Positive Threshold (default: 1.05) – Short SMA is at least 5% above Long SMA.
- Red 🔴 Negative Momentum: Ratio ≤ Negative Threshold (default: 0.95) – Short SMA is at least 5% below Long SMA.
- Gray ⚪ Neutral: Ratio between the two thresholds.
📈 How to Use
- Trend Confirmation: Use the state line color to quickly confirm the prevailing momentum.
- Green 🟢: Consider focusing on long setups
- Red 🔴: Consider focusing on short setups
- Gray ⚪: Consider staying neutral or waiting for stronger signals
- Trade Filtering: Filter trades in your existing strategy so they only align with the detected momentum phase.
- Early Warnings: Enable phase change alerts to get notified when market conditions shift.
⚙️ Customization
- SMA Periods: Adjust short and long SMA lengths to suit your trading timeframe.
- Thresholds: Tighten (closer to 1.00) for more frequent signals, or widen for fewer but stronger signals.
🔔 Alerts
- 🟢 Positive Momentum START – Stock/Security shifts into positive momentum.
- ⚪ Positive Momentum END – Positive momentum ends (neutral state).
- 🔴 Negative Momentum START – Market shifts into negative momentum.
- ⚪ Negative Momentum END – Negative momentum ends (neutral state).
- Momentum Phase Change – Any shift between Positive, Negative, or Neutral.
🎯 Add this indicator to your chart to track momentum phases like a pro — know exactly when trends start, end, or stall.
Korumalı komut dosyası
Bu komut dosyası kapalı kaynak olarak yayınlanmaktadır. Ancak, ücretsiz ve herhangi bir sınırlama olmaksızın kullanabilirsiniz – daha fazla bilgiyi buradan edinebilirsiniz.
Naved Iqbal
Feragatname
Bilgiler ve yayınlar, TradingView tarafından sağlanan veya onaylanan finansal, yatırım, alım satım veya diğer türden tavsiye veya öneriler anlamına gelmez ve teşkil etmez. Kullanım Koşulları bölümünde daha fazlasını okuyun.