PROTECTED SOURCE SCRIPT
Güncellendi True Range(TR) + Average True Range (ATR) COMBINED
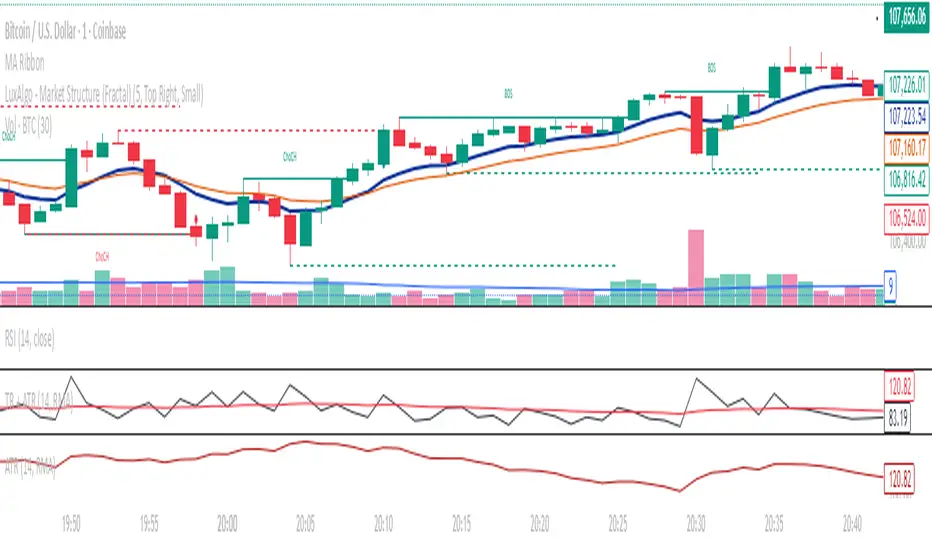
This indicator combines True Range (TR) and Average True Range (ATR) into a single panel for a clearer understanding of price volatility.
True Range (TR) measures the absolute price movement between highs, lows, and previous closes — showing raw, unsmoothed volatility.
Average True Range (ATR) is a moving average of the True Range, providing a smoother, more stable volatility signal.
📊 Usage Tips:
High TR/ATR values indicate strong price movement or volatility expansion.
Low values suggest compression or a potential volatility breakout zone.
Can be used for stop-loss placement, volatility filters, or trend strength confirmation.
⚙️ Features:
Multiple smoothing methods: RMA, SMA, EMA, WMA.
Adjustable ATR length.
Separate colored plots for TR (yellow) and ATR (red).
Works across all timeframes and instruments.
Sürüm Notları
This indicator combines True Range (TR) and Average True Range (ATR) into a single panel for a clearer understanding of price volatility.True Range (TR) measures the absolute price movement between highs, lows, and previous closes — showing raw, unsmoothed volatility.
Average True Range (ATR) is a moving average of the True Range, providing a smoother, more stable volatility signal.
📊 Usage Tips:
High TR/ATR values indicate strong price movement or volatility expansion.
Low values suggest compression or a potential volatility breakout zone.
Can be used for stop-loss placement, volatility filters, or trend strength confirmation.
⚙️ Features:
Multiple smoothing methods: RMA, SMA, EMA, WMA.
Adjustable ATR length.
Separate colored plots for TR (yellow) and ATR (red).
Works across all timeframes and instruments.
Korumalı komut dosyası
Bu komut dosyası kapalı kaynak olarak yayınlanmaktadır. Ancak, ücretsiz ve herhangi bir sınırlama olmaksızın kullanabilirsiniz – daha fazla bilgiyi buradan edinebilirsiniz.
Feragatname
Bilgiler ve yayınlar, TradingView tarafından sağlanan veya onaylanan finansal, yatırım, alım satım veya diğer türden tavsiye veya öneriler anlamına gelmez ve teşkil etmez. Kullanım Koşulları bölümünde daha fazlasını okuyun.