PROTECTED SOURCE SCRIPT
Daily Short-Term Levels & Pivots with BOS/CHoCH
Daily Short-Term Levels & Pivots with BOS/CHoCH
OverviewThis indicator combines essential tools for short-term and long-term traders, integrating Daily Short-Term Levels (NDCP), Pivots, and detection of Break of Structure (BOS) and Change of Character (CHoCH). Designed for TradingView, it’s ideal for scalping, day trading, and market structure analysis across any timeframe. It provides clear visualization of key levels, pivots, and structural patterns, with customizable settings to suit various trading styles.
Key Features
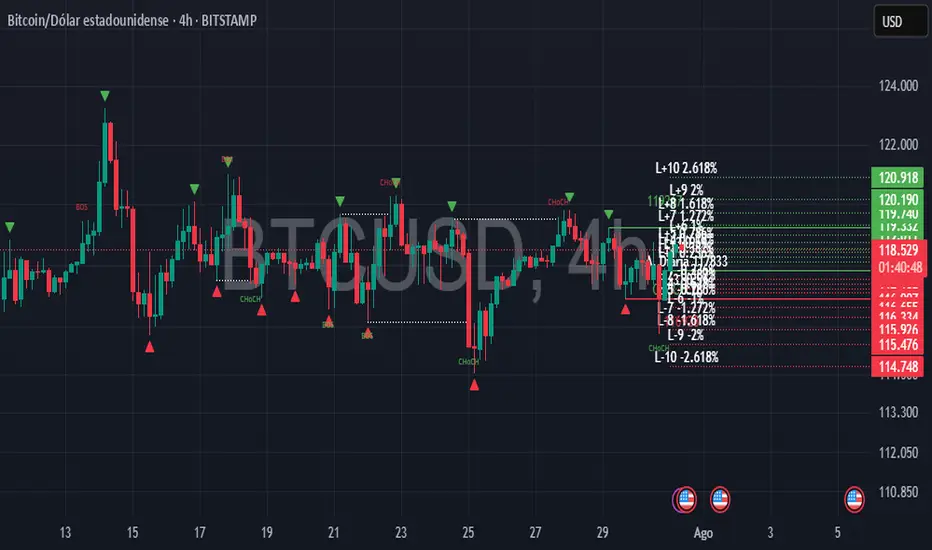
1. Daily Short-Term Levels (NDCP)
Purpose: Displays support and resistance levels based on the daily open, calculated as bullish and bearish percentages.
Levels: Up to 10 bullish levels (L+1 to L+10) and 10 bearish levels (L-1 to L-10), with configurable percentages (default: 0.236% to 2.618%).
Daily Open: A line marking the daily open price, with an option to display its value.
Customization:
Enable/disable levels and daily open.
Adjust colors, line thickness, and style (solid, dashed, dotted).
Position labels (Left, Right, Center) with adjustable offsets.
Show levels on all timeframes or only on daily and higher.
2. Pivots
Purpose: Identifies significant highs and lows (pivots) on the chart, useful for spotting reversal or continuation points.
Visualization: Green triangles (highs) and red triangles (lows) mark pivot points.
Customization:
Enable/disable pivot visualization.
Adjust the number of left and right bars to define pivots (default: 5 bars).
Change triangle colors.
3. Break of Structure (BOS) and Change of Character (CHoCH)
Purpose: Detects Break of Structure (BOS) and Change of Character (CHoCH) based on pivots, aiding in trend identification and reversals.
Visualization:
Resistance (green) and support (red) lines drawn from the latest pivots.
Labels for "BOS" (trend continuation), "CHoCH" (trend reversal), and "CD" (cross detected).
Historical CHoCH lines (optional, dotted) to track past structural changes.
Customization:
Enable/disable BOS/CHoCH and historical CHoCH lines.
Adjust colors and thickness for lines and labels.
Configure pivot sensitivity for BOS/CHoCH detection.
Indicator Settings
General Settings
Enable Daily Short-Term Levels: Toggle daily open-based levels.
Enable Pivots: Show triangles for significant highs/lows.
Enable BOS and CHoCH: Activate detection of structural breaks and reversals.
Daily Short-Term Levels
Show Daily Levels: Enable/disable bullish and bearish level lines.
Enable on All Timeframes: Display levels on intraday timeframes (e.g., 1M, 5M).
Text Color: Set the color for level labels.
Daily Open: Options to show the open line, its value, color, thickness, and style.
Label Alignment: Left (near daily open), Right (chart edge), or Center, with adjustable offsets.
Bullish/Bearish Levels: Configure percentages (0.236% to 2.618%), colors, line thickness, style, and value visibility.
Pivots and BOS/CHoCH
Pivot Colors: Green for highs, red for lows.
Left/Right Bars: Define pivot sensitivity (number of bars without breaking the high/low).
Show BOS: Enable labels for structural breaks.
Show Historical CHoCH Lines: Display dotted lines for past CHoCH events.
Colors and Thickness: Customize support, resistance, BOS, CHoCH lines, and "CD" labels.
How to Use
Add to Chart:
Search for "Daily Short-Term Levels & Pivots with BOS/CHoCH" in TradingView’s indicators and add it.
Initial Setup:
By default, daily levels, pivots, and BOS/CHoCH are enabled.
Adjust level percentages, colors, and styles to match your strategy.
Interpretation:
Daily Levels: Use bullish (L+1 to L+10) and bearish (L-1 to L-10) levels as support/resistance zones for entries, exits, or stops.
Pivots: Triangles mark key reversal or continuation points. Use them to confirm trends or identify high-probability zones.
BOS/CHoCH:
BOS: Indicates trend continuation (bullish if breaking a support, bearish if breaking a resistance).
CHoCH: Signals a potential trend reversal (bullish to bearish or vice versa).
CD: Confirms a pivot level cross, marking the start of a BOS or CHoCH.
Timeframes:
Ideal for scalping (1M, 5M) with "Enable on All Timeframes" activated.
Effective on higher timeframes (4H, D) for structural analysis.
Customization:
Adjust pivot bars (left_bars, right_bars) for more/less sensitivity.
Configure label offsets to avoid clutter on detailed charts.
Notes and Recommendations
Scalping: Use low timeframes (1M, 5M) with "Enable on All Timeframes" for visible daily levels. Set left_bars/right_bars to lower values (3-5) for faster pivots.
Swing Trading: On higher timeframes (4H, D), daily levels and BOS/CHoCH help identify key trend zones.
Avoid Clutter: If labels overlap, adjust offset_etiquetas, offset_derecha, or offset_centro, or select "Right" or "Center" alignment.
Testing: Experiment with percentage settings and styles to suit your market (Forex, stocks, crypto, etc.).
Limitations: On very low timeframes, pivots may be sensitive to noise. Increase left_bars/right_bars for more robust pivots.
Acknowledgments
Developed with passion for the TradingView community. I hope this indicator enhances your technical analysis! Feel free to leave feedback or contact me with suggestions or issues.
Happy trading!
OverviewThis indicator combines essential tools for short-term and long-term traders, integrating Daily Short-Term Levels (NDCP), Pivots, and detection of Break of Structure (BOS) and Change of Character (CHoCH). Designed for TradingView, it’s ideal for scalping, day trading, and market structure analysis across any timeframe. It provides clear visualization of key levels, pivots, and structural patterns, with customizable settings to suit various trading styles.
Key Features
1. Daily Short-Term Levels (NDCP)
Purpose: Displays support and resistance levels based on the daily open, calculated as bullish and bearish percentages.
Levels: Up to 10 bullish levels (L+1 to L+10) and 10 bearish levels (L-1 to L-10), with configurable percentages (default: 0.236% to 2.618%).
Daily Open: A line marking the daily open price, with an option to display its value.
Customization:
Enable/disable levels and daily open.
Adjust colors, line thickness, and style (solid, dashed, dotted).
Position labels (Left, Right, Center) with adjustable offsets.
Show levels on all timeframes or only on daily and higher.
2. Pivots
Purpose: Identifies significant highs and lows (pivots) on the chart, useful for spotting reversal or continuation points.
Visualization: Green triangles (highs) and red triangles (lows) mark pivot points.
Customization:
Enable/disable pivot visualization.
Adjust the number of left and right bars to define pivots (default: 5 bars).
Change triangle colors.
3. Break of Structure (BOS) and Change of Character (CHoCH)
Purpose: Detects Break of Structure (BOS) and Change of Character (CHoCH) based on pivots, aiding in trend identification and reversals.
Visualization:
Resistance (green) and support (red) lines drawn from the latest pivots.
Labels for "BOS" (trend continuation), "CHoCH" (trend reversal), and "CD" (cross detected).
Historical CHoCH lines (optional, dotted) to track past structural changes.
Customization:
Enable/disable BOS/CHoCH and historical CHoCH lines.
Adjust colors and thickness for lines and labels.
Configure pivot sensitivity for BOS/CHoCH detection.
Indicator Settings
General Settings
Enable Daily Short-Term Levels: Toggle daily open-based levels.
Enable Pivots: Show triangles for significant highs/lows.
Enable BOS and CHoCH: Activate detection of structural breaks and reversals.
Daily Short-Term Levels
Show Daily Levels: Enable/disable bullish and bearish level lines.
Enable on All Timeframes: Display levels on intraday timeframes (e.g., 1M, 5M).
Text Color: Set the color for level labels.
Daily Open: Options to show the open line, its value, color, thickness, and style.
Label Alignment: Left (near daily open), Right (chart edge), or Center, with adjustable offsets.
Bullish/Bearish Levels: Configure percentages (0.236% to 2.618%), colors, line thickness, style, and value visibility.
Pivots and BOS/CHoCH
Pivot Colors: Green for highs, red for lows.
Left/Right Bars: Define pivot sensitivity (number of bars without breaking the high/low).
Show BOS: Enable labels for structural breaks.
Show Historical CHoCH Lines: Display dotted lines for past CHoCH events.
Colors and Thickness: Customize support, resistance, BOS, CHoCH lines, and "CD" labels.
How to Use
Add to Chart:
Search for "Daily Short-Term Levels & Pivots with BOS/CHoCH" in TradingView’s indicators and add it.
Initial Setup:
By default, daily levels, pivots, and BOS/CHoCH are enabled.
Adjust level percentages, colors, and styles to match your strategy.
Interpretation:
Daily Levels: Use bullish (L+1 to L+10) and bearish (L-1 to L-10) levels as support/resistance zones for entries, exits, or stops.
Pivots: Triangles mark key reversal or continuation points. Use them to confirm trends or identify high-probability zones.
BOS/CHoCH:
BOS: Indicates trend continuation (bullish if breaking a support, bearish if breaking a resistance).
CHoCH: Signals a potential trend reversal (bullish to bearish or vice versa).
CD: Confirms a pivot level cross, marking the start of a BOS or CHoCH.
Timeframes:
Ideal for scalping (1M, 5M) with "Enable on All Timeframes" activated.
Effective on higher timeframes (4H, D) for structural analysis.
Customization:
Adjust pivot bars (left_bars, right_bars) for more/less sensitivity.
Configure label offsets to avoid clutter on detailed charts.
Notes and Recommendations
Scalping: Use low timeframes (1M, 5M) with "Enable on All Timeframes" for visible daily levels. Set left_bars/right_bars to lower values (3-5) for faster pivots.
Swing Trading: On higher timeframes (4H, D), daily levels and BOS/CHoCH help identify key trend zones.
Avoid Clutter: If labels overlap, adjust offset_etiquetas, offset_derecha, or offset_centro, or select "Right" or "Center" alignment.
Testing: Experiment with percentage settings and styles to suit your market (Forex, stocks, crypto, etc.).
Limitations: On very low timeframes, pivots may be sensitive to noise. Increase left_bars/right_bars for more robust pivots.
Acknowledgments
Developed with passion for the TradingView community. I hope this indicator enhances your technical analysis! Feel free to leave feedback or contact me with suggestions or issues.
Happy trading!
Korumalı komut dosyası
Bu komut dosyası kapalı kaynak olarak yayınlanmaktadır. Ancak, ücretsiz ve herhangi bir sınırlama olmaksızın kullanabilirsiniz – daha fazla bilgiyi buradan edinebilirsiniz.
Feragatname
Bilgiler ve yayınlar, TradingView tarafından sağlanan veya onaylanan finansal, yatırım, alım satım veya diğer türden tavsiye veya öneriler anlamına gelmez ve teşkil etmez. Kullanım Koşulları bölümünde daha fazlasını okuyun.