OPEN-SOURCE SCRIPT
Güncellendi lefrog_Price Range Waveform
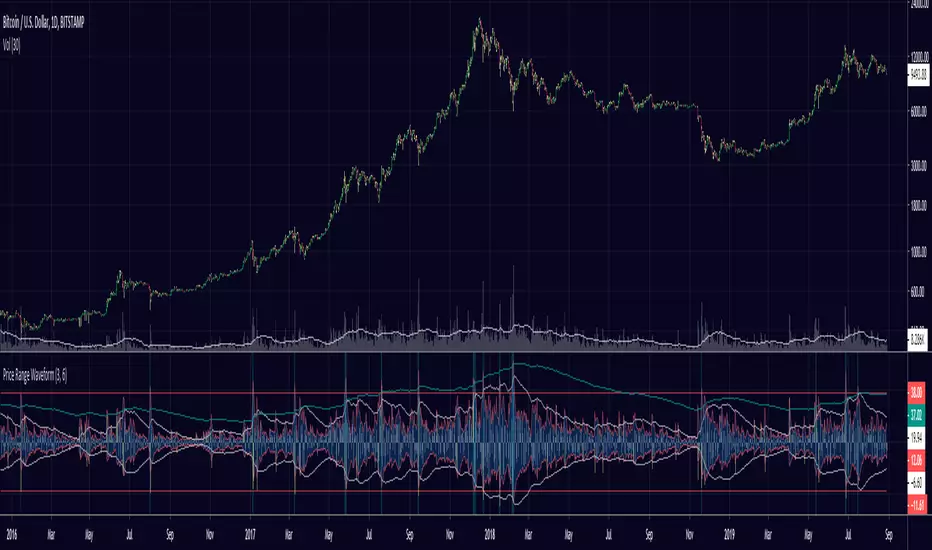
The Price Range Waveform calculated the difference from the open to close in percentage based.
The "Critical Range" input field lets you calibrate the zone above which a background color will be triggered.
Very useful in evaluating price expansion/contraction cycles and probable bottoms.
Works on any ticker and any timeframe.
Modification of the "Critical Range" default value may be mandatory.
Sürüm Notları
- Added the ability to color the signal based on the candle close.- Added the ability to plot the Waveform body with EMA instead of TEMA.
- Slight graphical improvements.
Sürüm Notları
- Screenshot updatedSürüm Notları
- Added a slower MA. Helps in spotting wider cycles- Code cleanup. Improved readability
Sürüm Notları
- Modified ThumbnailSürüm Notları
New in v1.6- Core calculation has been rewritten
- Bottom side of the waveform is now more relevant
- Added the ability to disable the signals from the property menu
Açık kaynak kodlu komut dosyası
Gerçek TradingView ruhuyla, bu komut dosyasının mimarı, yatırımcıların işlevselliğini inceleyip doğrulayabilmesi için onu açık kaynaklı hale getirdi. Yazarı tebrik ederiz! Ücretsiz olarak kullanabilseniz de, kodu yeniden yayınlamanın Topluluk Kurallarımıza tabi olduğunu unutmayın.
Feragatname
Bilgiler ve yayınlar, TradingView tarafından sağlanan veya onaylanan finansal, yatırım, alım satım veya diğer türden tavsiye veya öneriler anlamına gelmez ve teşkil etmez. Kullanım Koşulları bölümünde daha fazlasını okuyun.