OPEN-SOURCE SCRIPT
3 EMA Indicator
3 EMA Indicator Description
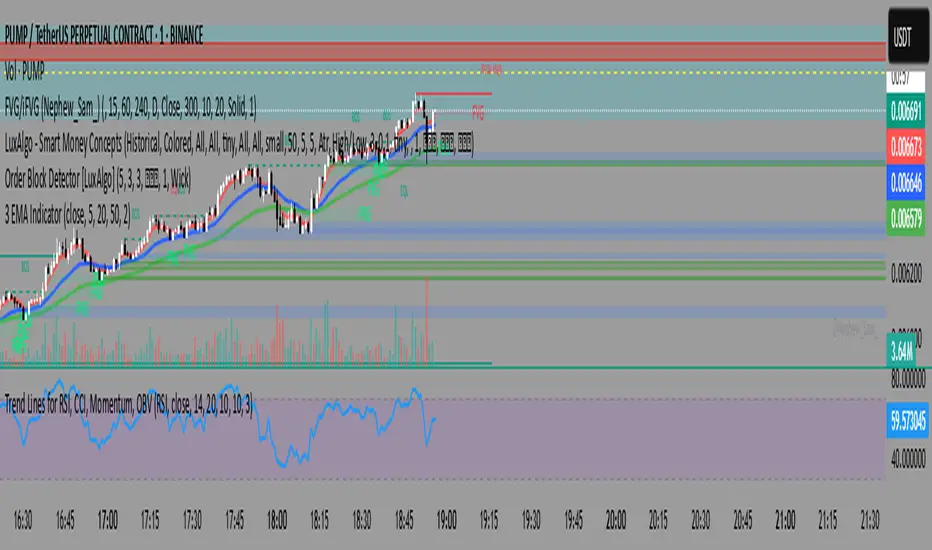
The 3 EMA Indicator is a customizable TradingView indicator designed to plot three Exponential Moving Averages (EMAs) on a price chart. It helps traders analyze trends, identify potential trading signals, and monitor price momentum through the interaction of three EMAs with user-defined periods.
Features
Three EMAs: Displays three EMAs with default periods of 9, 21, and 50, which can be adjusted via input settings.
Customizable Parameters:
Source: Choose the price data (e.g., close, open, hlc3) for EMA calculations (default: close).
EMA Periods: Set custom lengths for each EMA (minimum 1).
Colors: Assign unique colors to each EMA for clear visualization (default: red, blue, green).
Line Width: Adjust the thickness of EMA lines (default: 2).
Dynamic Label: A label on the last bar displays the configured EMA periods (e.g., "EMA1: 9, EMA2: 21, EMA3: 50") for easy reference.
Overlay: Plots directly on the price chart, making it intuitive to compare EMAs with price action.
Usage
Trend Analysis: Use the relative positions of the EMAs to identify bullish (e.g., shorter EMA above longer EMA) or bearish trends.
Crossover Signals: Monitor EMA crossovers (e.g., 9-period EMA crossing above the 21-period EMA) for potential buy or sell signals.
Customization: Adjust periods, colors, and line width through the indicator’s settings to match your trading strategy.
How to Apply
Open TradingView’s Pine Editor.
Copy and paste the indicator’s Pine Script code.
Add the indicator to your chart.
Customize settings (periods, source, colors, line width) via the indicator’s input panel.
This indicator is ideal for traders seeking a simple yet flexible tool to track price trends and momentum using multiple EMAs.
Açık kaynak kodlu komut dosyası
Gerçek TradingView ruhuna uygun olarak, bu komut dosyasının oluşturucusu bunu açık kaynaklı hale getirmiştir, böylece yatırımcılar betiğin işlevselliğini inceleyip doğrulayabilir. Yazara saygı! Ücretsiz olarak kullanabilirsiniz, ancak kodu yeniden yayınlamanın Site Kurallarımıza tabi olduğunu unutmayın.
Feragatname
Bilgiler ve yayınlar, TradingView tarafından sağlanan veya onaylanan finansal, yatırım, işlem veya diğer türden tavsiye veya tavsiyeler anlamına gelmez ve teşkil etmez. Kullanım Şartları'nda daha fazlasını okuyun.