PROTECTED SOURCE SCRIPT
Güncellendi Time-based Vertical Lines
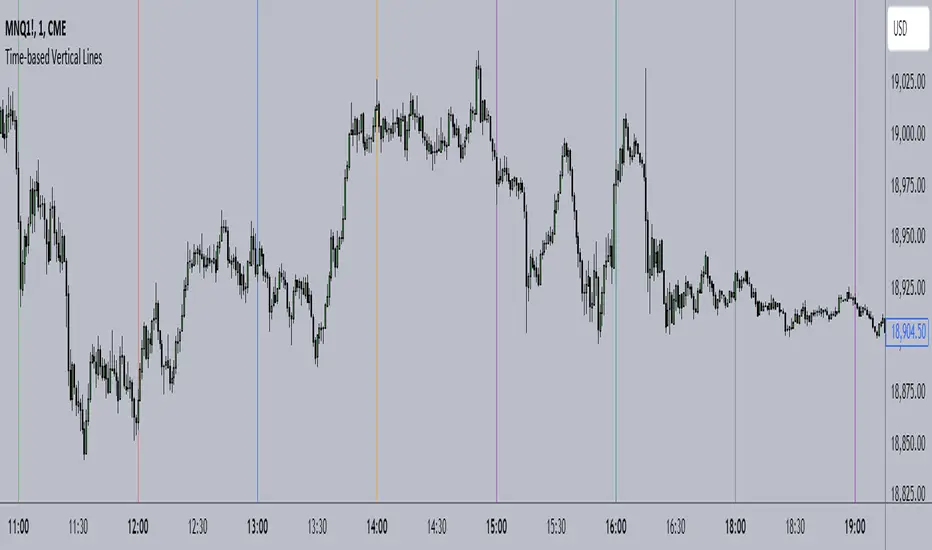
The Time-Based Vertical Line Script is a Pine Script tool designed to plot vertical lines at specific times during the trading day. The script allows users to mark important time-based events or price movement patterns by plotting fully customizable vertical lines on the chart. Each line can be configured with a specific time, color, width, and style, providing a clear visual reference for key moments throughout the trading session.
Key Features:
Custom Time Inputs:
Users can specify the hour and minute for each vertical line to mark crucial times, such as the opening or closing of a market session, or events like news releases.
The script can accommodate up to 24 vertical lines, each with individual time settings.
Customizable Appearance:
Color: Select different colors for each line to visually distinguish between important events or trading sessions.
Width: Adjust the thickness of the vertical lines to emphasize specific times.
Style: Choose from solid, dashed, or dotted lines for further customization.
No Built-in UTC Offset:
Important: This script does not automatically adjust for time zones or UTC offsets. The user must manually set the time for each vertical line based on the platform's server time or the desired trading session time.
If you are in a different time zone, you will need to calculate the time difference between your local time and the platform's time zone (which could be UTC or any other time zone).
For example, if the platform is set to UTC and you are in New York (UTC-4 during daylight savings), you will need to manually adjust your time inputs to match the time zone difference.
Static Time Configuration: The times you input for the vertical lines are fixed, meaning they won’t automatically adjust based on daylight savings or time zone shifts. You'll need to manually reconfigure the times if such changes occur.
Use Cases:
Session Marking: Mark the beginning and end of specific market sessions like New York, London, or Asian trading hours.
Event Monitoring: Plot lines to mark important economic events or news releases, ensuring you're prepared for potential market movements.
Strategy Tracking: For traders using time-sensitive strategies, such as the ICT (Inner Circle Trader) models, the script can help you highlight critical time windows for potential setups.
Important Note on Time Zone:
Since the script doesn't automatically apply a UTC offset, users need to figure out the correct time to input based on their own time zone and the platform's time zone. For example:
If you're in New York (UTC-4) and want to mark the New York session open at 9:30 AM, but your platform runs on UTC time, you would input 13:30 as the hour for the vertical line (since 9:30 AM UTC-4 corresponds to 13:30 UTC).
Example:
If your platform’s time is set to UTC, and you want to mark an event that happens at 10:00 AM in your local time zone (UTC-5), you'll need to set the vertical line to 15:00 (because 10:00 AM UTC-5 is 15:00 in UTC).
This means you'll need to calculate the offset based on your location and input the adjusted time into the script manually.
Sürüm Notları
converted to v6Korumalı komut dosyası
Bu komut dosyası kapalı kaynak olarak yayınlanmaktadır. Ancak, ücretsiz ve herhangi bir sınırlama olmaksızın kullanabilirsiniz – daha fazla bilgiyi buradan edinebilirsiniz.
Doer
Feragatname
Bilgiler ve yayınlar, TradingView tarafından sağlanan veya onaylanan finansal, yatırım, alım satım veya diğer türden tavsiye veya öneriler anlamına gelmez ve teşkil etmez. Kullanım Koşulları bölümünde daha fazlasını okuyun.
Korumalı komut dosyası
Bu komut dosyası kapalı kaynak olarak yayınlanmaktadır. Ancak, ücretsiz ve herhangi bir sınırlama olmaksızın kullanabilirsiniz – daha fazla bilgiyi buradan edinebilirsiniz.
Feragatname
Bilgiler ve yayınlar, TradingView tarafından sağlanan veya onaylanan finansal, yatırım, alım satım veya diğer türden tavsiye veya öneriler anlamına gelmez ve teşkil etmez. Kullanım Koşulları bölümünde daha fazlasını okuyun.