PROTECTED SOURCE SCRIPT
Helios Bollinger Bands with enters and exits by Zekis
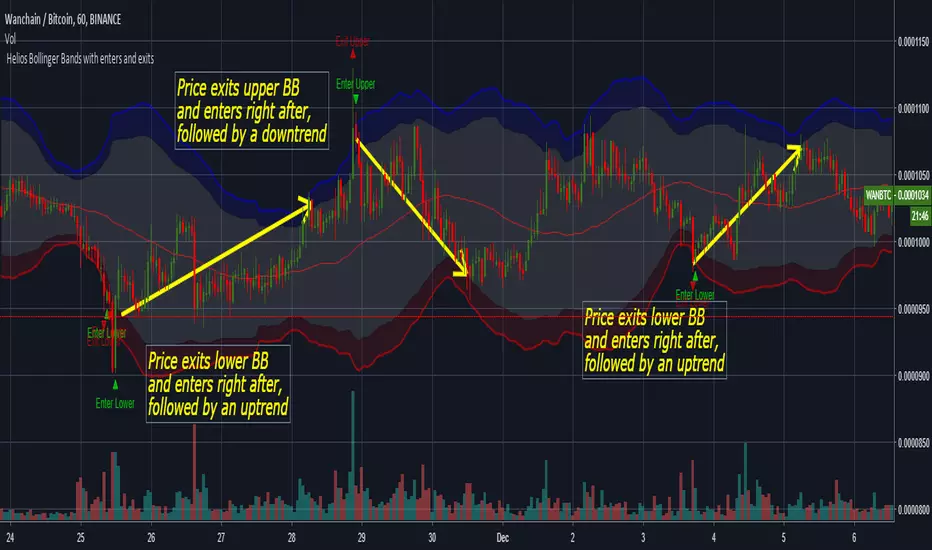
Classic Bollinger Bands with enters and exits from the channel
The purpose of Bollinger Bands is to provide a relative definition of high and low prices of a market. By definition, prices are high at the upper band and low at the lower band. This definition can aid in rigorous pattern recognition and is useful in comparing price action to the action of indicators to arrive at systematic trading decisions
The use of Bollinger Bands varies widely among traders. Some traders buy when price touches the lower Bollinger Band and exit when price touches the moving average in the center of the bands. Other traders buy when price breaks above the upper Bollinger Band or sell when price falls below the lower Bollinger Band . Moreover, the use of Bollinger Bands is not confined to stock traders; options traders, most notably implied volatility traders, often sell options when Bollinger Bands are historically far apart or buy options when the Bollinger Bands are historically close together, in both instances, expecting volatility to revert towards the average historical volatility level for the stock.
When the bands lie close together, a period of low volatility is indicated. Conversely, as the bands expand, an increase in price action/market volatility is indicated. When the bands have only a slight slope and track approximately parallel for an extended time, the price will generally be found to oscillate between the bands as though in a channel.
Traders are often inclined to use Bollinger Bands with other indicators to confirm price action. In particular, the use of oscillator-like Bollinger Bands will often be coupled with a non-oscillator indicator-like chart patterns or a trendline . If these indicators confirm the recommendation of the Bollinger Bands , the trader will have greater conviction that the bands are predicting correct price action in relation to market volatility .
en.wikipedia.org/wiki/Bollinger_Bands
Enjoy!
zekis
Korumalı komut dosyası
Bu komut dosyası kapalı kaynak olarak yayınlanmaktadır. Ancak, özgürce ve herhangi bir sınırlama olmaksızın kullanabilirsiniz – daha fazla bilgi burada.
Feragatname
Bilgiler ve yayınlar, TradingView tarafından sağlanan veya onaylanan finansal, yatırım, işlem veya diğer türden tavsiye veya tavsiyeler anlamına gelmez ve teşkil etmez. Kullanım Şartları'nda daha fazlasını okuyun.