OPEN-SOURCE SCRIPT
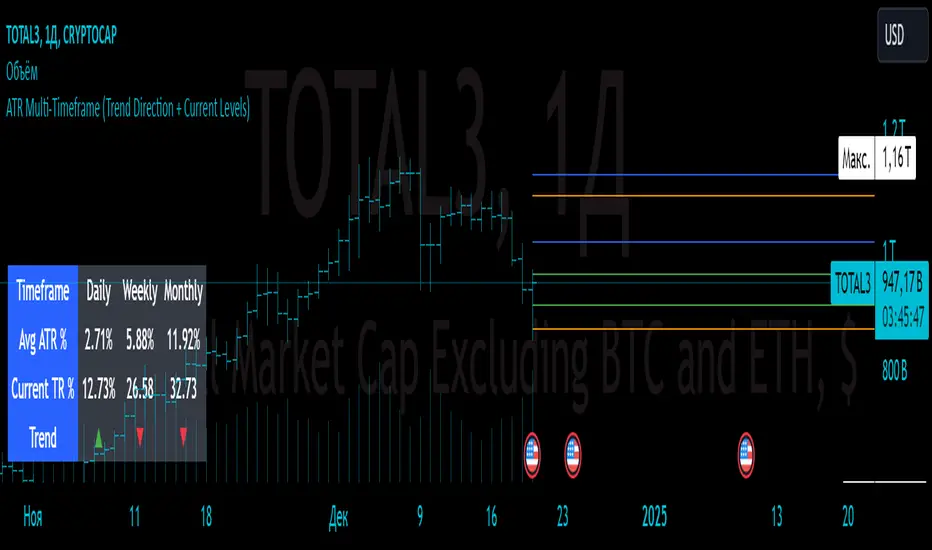
ATR Multi-Timeframe (Trend Direction + Current Levels)
Indicator Name
ATR Multi-Timeframe (Trend Direction + Current Levels)
Description
This indicator helps you visualize support and resistance levels based on the Average True Range (ATR) and track the current trend direction across multiple timeframes (daily, weekly, and monthly). It is a valuable tool for traders looking to enhance decision-making and market volatility analysis.
Key Features
Multi-Timeframe ATR Analysis:
Calculates the Average True Range (ATR) and True Range (TR) for daily, weekly, and monthly timeframes.
Trend Direction Indicators:
Displays trend direction using arrows (▲ for uptrend, ▼ for downtrend) with color-coded labels (green for uptrend, red for downtrend).
Support and Resistance Levels:
Dynamically calculates trend levels (Open ± ATR) and opposite levels for each timeframe.
Persistent lines extend these levels into the future for better visualization.
Customizable Settings:
Toggle visibility of daily, weekly, and monthly levels.
Adjust line width and colors for each timeframe.
Summary Table:
Displays a compact table showing ATR percentages, TR percentages, and trend direction for all timeframes.
Why Use This Indicator?
Quickly identify key support and resistance levels across different timeframes.
Understand market volatility through ATR-based levels.
Spot trends and reversals with easy-to-read visual elements.
How to Use:
Add the indicator to your chart.
Enable or disable specific timeframes (Daily, Weekly, Monthly) in the settings.
Adjust line styles and colors to match your preferences.
Use the displayed levels to plan entry/exit points or manage risk.
This indicator is perfect for both swing and intraday traders who want a clear and dynamic view of volatility and trend across multiple timeframes.
Açık kaynak kodlu komut dosyası
Gerçek TradingView ruhuyla, bu komut dosyasının mimarı, yatırımcıların işlevselliğini inceleyip doğrulayabilmesi için onu açık kaynaklı hale getirdi. Yazarı tebrik ederiz! Ücretsiz olarak kullanabilseniz de, kodu yeniden yayınlamanın Topluluk Kurallarımıza tabi olduğunu unutmayın.
Feragatname
Bilgiler ve yayınlar, TradingView tarafından sağlanan veya onaylanan finansal, yatırım, alım satım veya diğer türden tavsiye veya öneriler anlamına gelmez ve teşkil etmez. Kullanım Koşulları bölümünde daha fazlasını okuyun.