PROTECTED SOURCE SCRIPT
Güncellendi Pattern Finder with MTF Boxes (Break - Fixed)
Script Title:
MTF Supply/Demand Zone Indicator with Candlestick Pattern Confirmation
Short Description:
This advanced strategy identifies key Supply and Demand zones (Order Blocks) on higher timeframes (30m & 1h) and then waits for a pullback to these zones on the current timeframe. The final entry signal is triggered upon the appearance of a valid candlestick pattern (e.g., Hammer, Engulfing) within these zones.
Full Description:
Introduction & Core Concept
This script is a powerful trading tool based on a combination of the following concepts:
Multi-Timeframe (MTF) Analysis: Identifying significant structures on higher timeframes to understand the bigger market picture.
Supply and Demand Zones: Finding areas where an imbalance between buyers and sellers has caused strong price movements.
Candlestick Patterns: Using classic candlestick patterns as the final confirmation for entering a trade at these key zones.
The main idea is to avoid trading blindly and instead wait for the price to react to a significant zone, then enter with a confirmation signal.
How the Strategy Works (Step-by-Step)
Identifying the Key Pattern on Higher Timeframes:
The script continuously monitors the 30-minute and 1-hour charts to find a specific pattern: a short consolidation period (usually 1-4 candles) immediately followed by a breakout with a powerful, high-momentum candle (Long Bar). This pattern indicates the formation of a fresh Supply or Demand Zone.
Drawing the Supply and Demand Boxes:
Green Box (Demand Zone): When a minor high is broken by a bullish Long Bar, this area is identified as potential support and marked with a green box.
Red Box (Supply Zone): When a minor low is broken by a bearish Long Bar, this area is identified as potential resistance and marked with a red box.
White Box (Long Bar / Trigger Zone): This box highlights the range of the Long Bar candle itself. A break of or return to this zone provides important signals.
Waiting for a Pullback:
After a zone is identified and drawn, the strategy waits for the price on your current chart to pull back into this box.
Entry Confirmation with Candlestick Patterns:
Once the price enters the box, the script looks for reversal candlestick patterns:
In a Demand Zone (Green Box): It looks for bullish patterns like the Hammer, Bullish Engulfing, Bullish Harami, and Morning Star. Upon detection, a BUY label appears on the chart.
In a Supply Zone (Red Box): It looks for bearish patterns like the Hanging Man, Shooting Star, Bearish Engulfing, Bearish Harami, and Evening Star. Upon detection, a SELL label appears.
Breakout Signal:
In addition to reversal signals, if the price breaks the White Box (Long Bar Zone) in the opposite direction, a breakout signal is generated, which could indicate a trend continuation.
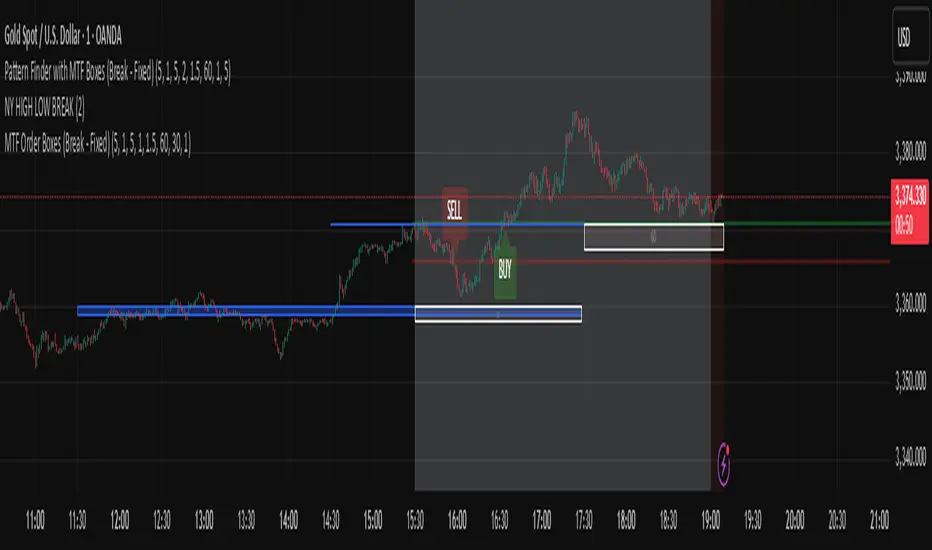
Visual Elements on the Chart
Green/Red Boxes: The primary Supply and Demand zones from higher timeframes.
White Boxes: The range of the Long Bar candle that activated the primary zone.
BUY/SELL Labels: Trade signals that appear after a candlestick confirmation within the zones.
Moving Averages (SMA 100 & 200): Included to help identify the overall market trend. Trades aligned with the trend are generally more reliable.
Input Settings
period ATR & Bar multiplayer: Allow you to customize the definition of a "Long Bar" based on market volatility.
Number of candle for long bar avrage: The lookback period for calculating the average candle body size.
multiplayer for tp: A multiplier to calculate the take-profit based on the stop-loss size (Risk-to-Reward ratio).
How to Use This Strategy
Apply the script to your main trading timeframe (e.g., 5-minute or 15-minute).
Wait for a Supply (Red) or Demand (Green) zone to be drawn on your chart.
Be patient and wait for the price to return to this zone.
If a BUY or SELL label appears, consider it a valid entry signal.
Always combine these signals with your own analysis and the overall market context.
Disclaimer: This script is an analytical tool and should not be the sole basis for your trading decisions. Always practice proper risk management and thoroughly backtest its performance before using it in a live account.
MTF Supply/Demand Zone Indicator with Candlestick Pattern Confirmation
Short Description:
This advanced strategy identifies key Supply and Demand zones (Order Blocks) on higher timeframes (30m & 1h) and then waits for a pullback to these zones on the current timeframe. The final entry signal is triggered upon the appearance of a valid candlestick pattern (e.g., Hammer, Engulfing) within these zones.
Full Description:
Introduction & Core Concept
This script is a powerful trading tool based on a combination of the following concepts:
Multi-Timeframe (MTF) Analysis: Identifying significant structures on higher timeframes to understand the bigger market picture.
Supply and Demand Zones: Finding areas where an imbalance between buyers and sellers has caused strong price movements.
Candlestick Patterns: Using classic candlestick patterns as the final confirmation for entering a trade at these key zones.
The main idea is to avoid trading blindly and instead wait for the price to react to a significant zone, then enter with a confirmation signal.
How the Strategy Works (Step-by-Step)
Identifying the Key Pattern on Higher Timeframes:
The script continuously monitors the 30-minute and 1-hour charts to find a specific pattern: a short consolidation period (usually 1-4 candles) immediately followed by a breakout with a powerful, high-momentum candle (Long Bar). This pattern indicates the formation of a fresh Supply or Demand Zone.
Drawing the Supply and Demand Boxes:
Green Box (Demand Zone): When a minor high is broken by a bullish Long Bar, this area is identified as potential support and marked with a green box.
Red Box (Supply Zone): When a minor low is broken by a bearish Long Bar, this area is identified as potential resistance and marked with a red box.
White Box (Long Bar / Trigger Zone): This box highlights the range of the Long Bar candle itself. A break of or return to this zone provides important signals.
Waiting for a Pullback:
After a zone is identified and drawn, the strategy waits for the price on your current chart to pull back into this box.
Entry Confirmation with Candlestick Patterns:
Once the price enters the box, the script looks for reversal candlestick patterns:
In a Demand Zone (Green Box): It looks for bullish patterns like the Hammer, Bullish Engulfing, Bullish Harami, and Morning Star. Upon detection, a BUY label appears on the chart.
In a Supply Zone (Red Box): It looks for bearish patterns like the Hanging Man, Shooting Star, Bearish Engulfing, Bearish Harami, and Evening Star. Upon detection, a SELL label appears.
Breakout Signal:
In addition to reversal signals, if the price breaks the White Box (Long Bar Zone) in the opposite direction, a breakout signal is generated, which could indicate a trend continuation.
Visual Elements on the Chart
Green/Red Boxes: The primary Supply and Demand zones from higher timeframes.
White Boxes: The range of the Long Bar candle that activated the primary zone.
BUY/SELL Labels: Trade signals that appear after a candlestick confirmation within the zones.
Moving Averages (SMA 100 & 200): Included to help identify the overall market trend. Trades aligned with the trend are generally more reliable.
Input Settings
period ATR & Bar multiplayer: Allow you to customize the definition of a "Long Bar" based on market volatility.
Number of candle for long bar avrage: The lookback period for calculating the average candle body size.
multiplayer for tp: A multiplier to calculate the take-profit based on the stop-loss size (Risk-to-Reward ratio).
How to Use This Strategy
Apply the script to your main trading timeframe (e.g., 5-minute or 15-minute).
Wait for a Supply (Red) or Demand (Green) zone to be drawn on your chart.
Be patient and wait for the price to return to this zone.
If a BUY or SELL label appears, consider it a valid entry signal.
Always combine these signals with your own analysis and the overall market context.
Disclaimer: This script is an analytical tool and should not be the sole basis for your trading decisions. Always practice proper risk management and thoroughly backtest its performance before using it in a live account.
Sürüm Notları
In this update, the boxes will be drawn based on your desired time frame and are adjustable from 1 minute to 240 minutes. However, for the proper utilization of the indicator, it is better to set one of the time frames to your analysis time frame, for example, 4-hour for analysis, and the second time frame should be considered for entry confirmation, for example, 5 minutes. But for optimal use, select a higher time frame, for instance, 4-hour, and set the chart's time frame to your trade entry time frame, for example, 5 minutes. Wherever a touch with the box occurs, enter the trade. Your goal should be to gain only 15 to 30 pips of profit, and always be prepared to place your stop-loss behind the white box. I hope you are very profitable. This strategy is currently being updated, and its final version will be available to you on a monthly rental basis.Sürüm Notları
correct optional timeframeSürüm Notları
In the recent update, the strategy has been converted into an indicator. The box plotting areas have been optimized for the following currency pairs: XAUUSD, XAGUSD, BTCUSD, GBPUSD, US30, SOLUSD, EURUSD, and EURCAD.
Sürüm Notları
To better distinguish the boxes when the background is white, their color has been changed from white to gray with 80% transparency. This helps improve chart readability.Sürüm Notları
In this update, you can select the timeframe in which the box breakout occurs, which may give you less risk.
Sürüm Notları
Due to the use of the security function, signals were sometimes issued before the candle closed on a higher timeframe (e.g., a one-hour chart), which could lead to false signals. Therefore, this update attempts to address this issue by ensuring that no signal is generated until the higher timeframe candle (e.g., the one-hour candle) has fully closed.Sürüm Notları
This update focuses on reducing sensitivity and relaxing the filters to present more accurate and reliable boxes."This option uses words like "focuses" and "accurate" to sound more purposeful and confident. "Relaxing the filters" is a great way to say that you're making them less restrictive.
Korumalı komut dosyası
Bu komut dosyası kapalı kaynak olarak yayınlanmaktadır. Ancak, ücretsiz ve herhangi bir sınırlama olmaksızın kullanabilirsiniz – daha fazla bilgiyi buradan edinebilirsiniz.
Feragatname
Bilgiler ve yayınlar, TradingView tarafından sağlanan veya onaylanan finansal, yatırım, alım satım veya diğer türden tavsiye veya öneriler anlamına gelmez ve teşkil etmez. Kullanım Koşulları bölümünde daha fazlasını okuyun.