PROTECTED SOURCE SCRIPT
Bell Curve Levels

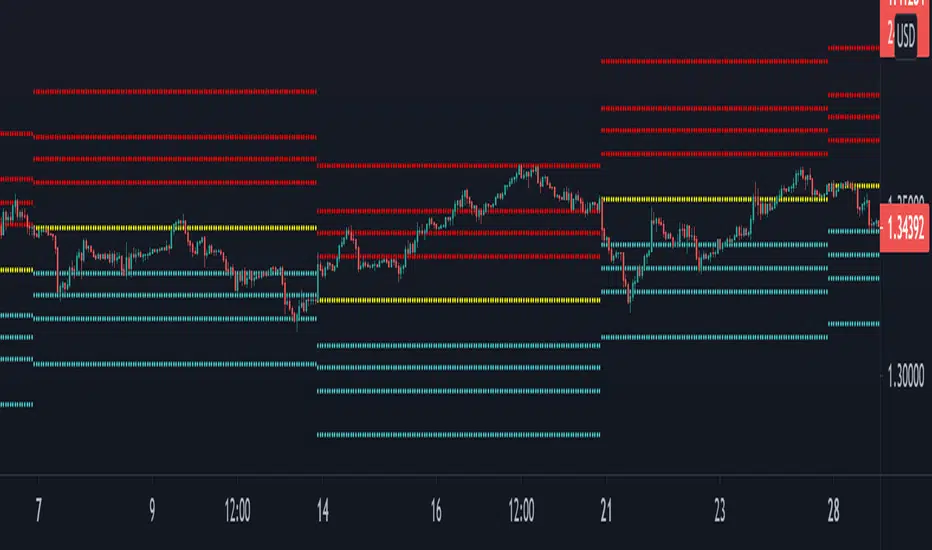
Script which plots the % change from the open and overlays the 1, 1.5, 2 & 3% levels on the chart.
The bell curve offers a quantifiable clue to the persistent percentages the price moves in the fx market. A simple histogram will convey the %change in bins
this indicator just reflects that with levels on the chart.
Can be an aide for intraday or longer term levels.
Feel free to message me with any queries.
Korumalı komut dosyası
Bu komut dosyası kapalı kaynak olarak yayınlanmaktadır. Ancak, ücretsiz ve herhangi bir sınırlama olmaksızın kullanabilirsiniz – daha fazla bilgiyi buradan edinebilirsiniz.
Feragatname
Bilgiler ve yayınlar, TradingView tarafından sağlanan veya onaylanan finansal, yatırım, alım satım veya diğer türden tavsiye veya öneriler anlamına gelmez ve teşkil etmez. Kullanım Koşulları bölümünde daha fazlasını okuyun.