OPEN-SOURCE SCRIPT
Sri Yantra-Scret Geometry - AYNET
Explanation of the Script
Inputs:
periods: Number of bars used for calculating the moving average and standard deviation.
yloc: Chooses the display location (above or below the bars).
Moving Average and Standard Deviation:
ma: Moving average of the close price for the specified period.
std: Standard deviation, used to set the range for the Sri Yantra triangle points.
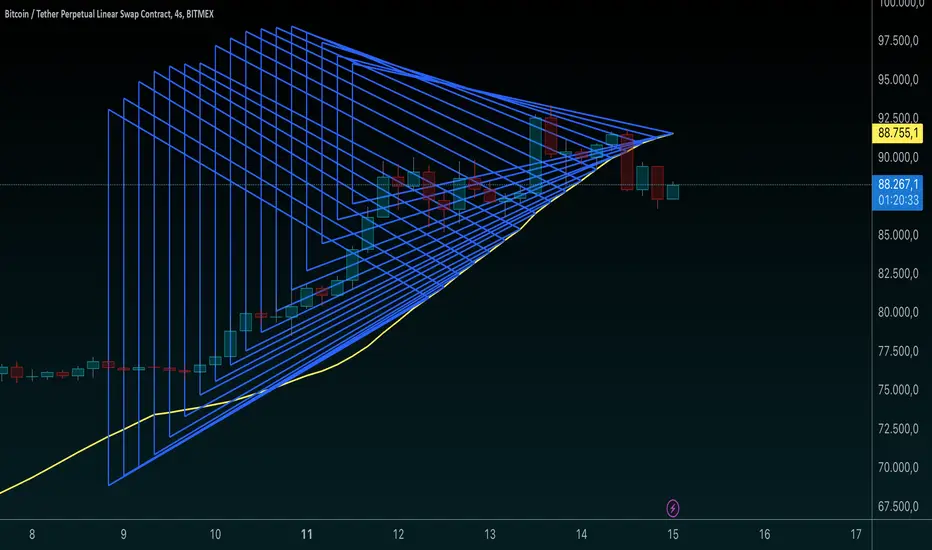
Triangle Points:
p1, p2, and p3 are the points for constructing the triangle, with p1 and p2 set at two standard deviations above and below the moving average, and p3 at the moving average itself.
Sri Yantra Triangle Drawing:
Three lines form a triangle, with the moving average line serving as the midpoint anchor.
The triangle pattern shifts across bars as new moving average values are calculated.
Moving Average Plot:
The moving average is plotted in red for visual reference against the triangle pattern.
This basic script emulates the Sri Yantra pattern using price data, creating a spiritual and aesthetic overlay on price charts, ideal for users looking to incorporate sacred geometry into their technical analysis.
Inputs:
periods: Number of bars used for calculating the moving average and standard deviation.
yloc: Chooses the display location (above or below the bars).
Moving Average and Standard Deviation:
ma: Moving average of the close price for the specified period.
std: Standard deviation, used to set the range for the Sri Yantra triangle points.
Triangle Points:
p1, p2, and p3 are the points for constructing the triangle, with p1 and p2 set at two standard deviations above and below the moving average, and p3 at the moving average itself.
Sri Yantra Triangle Drawing:
Three lines form a triangle, with the moving average line serving as the midpoint anchor.
The triangle pattern shifts across bars as new moving average values are calculated.
Moving Average Plot:
The moving average is plotted in red for visual reference against the triangle pattern.
This basic script emulates the Sri Yantra pattern using price data, creating a spiritual and aesthetic overlay on price charts, ideal for users looking to incorporate sacred geometry into their technical analysis.
Açık kaynak kodlu komut dosyası
Gerçek TradingView ruhuyla, bu komut dosyasının mimarı, yatırımcıların işlevselliğini inceleyip doğrulayabilmesi için onu açık kaynaklı hale getirdi. Yazarı tebrik ederiz! Ücretsiz olarak kullanabilseniz de, kodu yeniden yayınlamanın Topluluk Kurallarımıza tabi olduğunu unutmayın.
Feragatname
Bilgiler ve yayınlar, TradingView tarafından sağlanan veya onaylanan finansal, yatırım, alım satım veya diğer türden tavsiye veya öneriler anlamına gelmez ve teşkil etmez. Kullanım Koşulları bölümünde daha fazlasını okuyun.