OPEN-SOURCE SCRIPT
DBG X WOLONG
📊 USER GUIDE – DBG X WOLONG ALGORITHM
🎯 OVERVIEW
The DBG X WOLONG Future Algorithm is a Pine Script v5 that integrates multiple advanced technical indicators, enabling traders to analyze markets and make precise trading decisions.
⚙️ MAIN SETTINGS
🔹 Sensitivity
Value: 1–20 (Default: 6)
Function: Adjusts the sensitivity of the SuperTrend signal
Guidelines:
Low value (1–5): Fewer signals, higher accuracy
High value (15–20): More signals, but with possible noise
🎨 DISPLAY SETTINGS
🔹 Candle Colors
Version 1: Based on MACD histogram
Version 2: Based on SuperTrend
🔹 Color Themes
Theme 1: Traditional Green/Red
Theme 2: Gold/Purple
Theme 3: Blue/Orange
No Fill: No background color displayed
📊 TRADING SIGNALS
🔹 Buy/Sell Signals
BUY 🚀 appears when:
SuperTrend shifts from bearish to bullish
Closing price > SMA 13
Braid Filter confirms
SELL appears when:
SuperTrend shifts from bullish to bearish
Closing price < SMA 13
Braid Filter confirms
🔹 Reversal Signals
▲ (Up Arrow): Buy signal when RSI crosses above 30
▼ (Down Arrow): Sell signal when RSI crosses below 70
🔹 Pullback Signals
▲ Purple: Pullback in bullish trend
▼ Purple: Pullback in bearish trend
🎯 TAKE PROFIT & STOP LOSS
🔹 TP Modes
Version 1: TP based on pivot points
Version 2: TP based on regression line
Close Price: TP at candle close
🔹 TP/SL Settings
TP Ratio: 2.0 (Default)
TP Length: 150 (Default)
ATR SL Length: 10
ATR SL Risk: 1.9
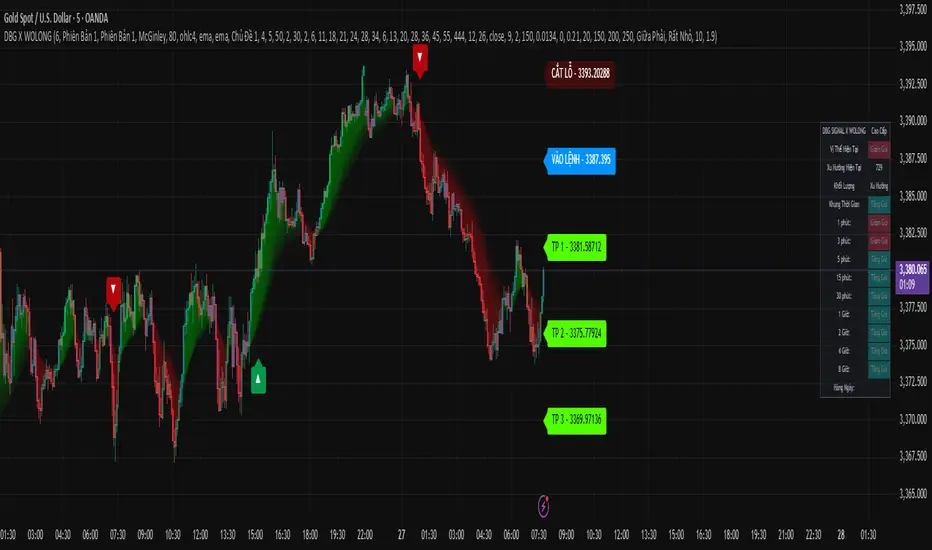
🔹 Labels Displayed
ENTRY: Entry point
STOP LOSS: Stop loss point
TP 1/2/3: 3 take profit levels
☁️ MOVING AVERAGE CLOUD
🔹 Supported MA Types
SMA – Simple Moving Average
EMA – Exponential Moving Average
WMA – Weighted Moving Average
HMA – Hull Moving Average
ALMA – Arnaud Legoux Moving Average
McGinley – McGinley Dynamic
FRAMA – Fractal Adaptive Moving Average
🔹 Cloud Cycles
Default: 2, 6, 11, 18, 21, 24, 28, 34
Customizable: All 8 cycles
🔹 Ribbon Cycles
Default: 6, 13, 20, 28, 36, 45, 55, 444
Customizable: All 8 cycles
🔧 BRAID FILTER
🔹 Function
Filters out noise signals
Confirms strong trends
🔹 Settings
MA Filter: McGinley (Recommended)
Filter Strength: 80% (Default)
📈 TRENDS & INDICATORS
🔹 SuperTrend
Main trend indicator
Generates primary buy/sell signals
🔹 Advanced Ichimoku
Tenkan-Sen: Blue line
Kijun-Sen: Orange line
Senkou Span A/B: Ichimoku cloud
🔹 Trend Tracking
Based on EMA 10 vs EMA 20
Candle colors follow trend direction
🔹 Trend Catcher
Range Filter with multiple options
Adjustable sensitivity
📊 MULTI-TIMEFRAME TREND PANEL
🔹 Displayed Timeframes
1m, 3m, 5m
15m, 30m, 1H
2H, 4H, 8H, Daily
🔹 Displayed Info
Current Position: Bullish/Bearish
Trend: Per timeframe
Volume: Current trading volume
🔹 Panel Positioning
9 selectable positions
Sizes: Large, Normal, Small, Extra Small
🚀 TRADE EXECUTION
📈 LONG ENTRY
✅ Entry Conditions
BUY 🚀 signal appears
SuperTrend turns from red to green
Price > SMA 13
Braid Filter confirms (green)
Trend Panel shows "Bullish" across multiple TFs
📊 Additional Confirmations
MACD Histogram > 0 and rising
RSI crosses above 30 (if reversal signal)
EMA Pullback shows ▲ purple
🎯 Trade Management
Entry: According to ENTRY label
Stop Loss: According to STOP LOSS label
Take Profit: TP1 → TP2 → TP3
📉 SHORT ENTRY
✅ Entry Conditions
SELL signal appears
SuperTrend turns from green to red
Price < SMA 13
Braid Filter confirms (red)
Trend Panel shows "Bearish" across multiple TFs
📊 Additional Confirmations
MACD Histogram < 0 and declining
RSI crosses below 70 (if reversal signal)
EMA Pullback shows ▼ purple
🎯 Trade Management
Entry: According to ENTRY label
Stop Loss: According to STOP LOSS label
Take Profit: TP1 → TP2 → TP3
🎛️ RECOMMENDED SETTINGS
👥 For Beginners
Sensitivity: 6
Candle Colors: Version 1
Buy/Sell Signals: ON
Reversal Signals: OFF
Trend Panel: ON
🏆 For Experienced Traders
Sensitivity: 4–8 (depending on market)
Reversal Signals: ON
Pullback: ON
All indicators: ON
ATR SL Risk: 1.5–2.0
⚡ For Scalping
Sensitivity: 8–12
Timeframes: 1m, 3m, 5m
Use only: SuperTrend + Braid Filter
Quick TP: Only TP1
📊 For Swing Trading
Sensitivity: 4–6
Timeframes: 1H, 4H, 1D
Use all: Full signals
TP: All 3 levels (TP1, TP2, TP3)
⚠️ IMPORTANT NOTES
🔴 Avoid Trading When
Signals conflict across timeframes
Market is strongly ranging/sideways
Abnormally low volume
Price is at major support/resistance zones
🟢 Prefer Trading When
At least 2–3 confirmations align
Clear trend across multiple timeframes
Strong volume surge
Breakout from consolidation zone
💡 Usage Tips
Always wait for confirmation: Never enter with just 1 signal
Risk management: Place SL according to STOP LOSS label
Follow trend panel: Prioritize overall trend
Use multiple timeframes: Analyze top-down
Backtest first: Test strategy on historical data
🛠️ TROUBLESHOOTING
❓ No signals appear
Check if inputs are enabled
Adjust sensitivity
Try switching timeframe
❓ Too many false signals
Lower sensitivity
Increase Braid Filter strength
Trade only with main trend
❓ Trend panel not showing
Enable "Display Dashboard"
Select proper panel position
Adjust panel size
📞 SUPPORT
If you encounter issues using this script, please:
Carefully read this guide
Practice on a demo account
Backtest thoroughly before live trading
📈 Wishing you successful trading! 🚀
🎯 OVERVIEW
The DBG X WOLONG Future Algorithm is a Pine Script v5 that integrates multiple advanced technical indicators, enabling traders to analyze markets and make precise trading decisions.
⚙️ MAIN SETTINGS
🔹 Sensitivity
Value: 1–20 (Default: 6)
Function: Adjusts the sensitivity of the SuperTrend signal
Guidelines:
Low value (1–5): Fewer signals, higher accuracy
High value (15–20): More signals, but with possible noise
🎨 DISPLAY SETTINGS
🔹 Candle Colors
Version 1: Based on MACD histogram
Version 2: Based on SuperTrend
🔹 Color Themes
Theme 1: Traditional Green/Red
Theme 2: Gold/Purple
Theme 3: Blue/Orange
No Fill: No background color displayed
📊 TRADING SIGNALS
🔹 Buy/Sell Signals
BUY 🚀 appears when:
SuperTrend shifts from bearish to bullish
Closing price > SMA 13
Braid Filter confirms
SELL appears when:
SuperTrend shifts from bullish to bearish
Closing price < SMA 13
Braid Filter confirms
🔹 Reversal Signals
▲ (Up Arrow): Buy signal when RSI crosses above 30
▼ (Down Arrow): Sell signal when RSI crosses below 70
🔹 Pullback Signals
▲ Purple: Pullback in bullish trend
▼ Purple: Pullback in bearish trend
🎯 TAKE PROFIT & STOP LOSS
🔹 TP Modes
Version 1: TP based on pivot points
Version 2: TP based on regression line
Close Price: TP at candle close
🔹 TP/SL Settings
TP Ratio: 2.0 (Default)
TP Length: 150 (Default)
ATR SL Length: 10
ATR SL Risk: 1.9
🔹 Labels Displayed
ENTRY: Entry point
STOP LOSS: Stop loss point
TP 1/2/3: 3 take profit levels
☁️ MOVING AVERAGE CLOUD
🔹 Supported MA Types
SMA – Simple Moving Average
EMA – Exponential Moving Average
WMA – Weighted Moving Average
HMA – Hull Moving Average
ALMA – Arnaud Legoux Moving Average
McGinley – McGinley Dynamic
FRAMA – Fractal Adaptive Moving Average
🔹 Cloud Cycles
Default: 2, 6, 11, 18, 21, 24, 28, 34
Customizable: All 8 cycles
🔹 Ribbon Cycles
Default: 6, 13, 20, 28, 36, 45, 55, 444
Customizable: All 8 cycles
🔧 BRAID FILTER
🔹 Function
Filters out noise signals
Confirms strong trends
🔹 Settings
MA Filter: McGinley (Recommended)
Filter Strength: 80% (Default)
📈 TRENDS & INDICATORS
🔹 SuperTrend
Main trend indicator
Generates primary buy/sell signals
🔹 Advanced Ichimoku
Tenkan-Sen: Blue line
Kijun-Sen: Orange line
Senkou Span A/B: Ichimoku cloud
🔹 Trend Tracking
Based on EMA 10 vs EMA 20
Candle colors follow trend direction
🔹 Trend Catcher
Range Filter with multiple options
Adjustable sensitivity
📊 MULTI-TIMEFRAME TREND PANEL
🔹 Displayed Timeframes
1m, 3m, 5m
15m, 30m, 1H
2H, 4H, 8H, Daily
🔹 Displayed Info
Current Position: Bullish/Bearish
Trend: Per timeframe
Volume: Current trading volume
🔹 Panel Positioning
9 selectable positions
Sizes: Large, Normal, Small, Extra Small
🚀 TRADE EXECUTION
📈 LONG ENTRY
✅ Entry Conditions
BUY 🚀 signal appears
SuperTrend turns from red to green
Price > SMA 13
Braid Filter confirms (green)
Trend Panel shows "Bullish" across multiple TFs
📊 Additional Confirmations
MACD Histogram > 0 and rising
RSI crosses above 30 (if reversal signal)
EMA Pullback shows ▲ purple
🎯 Trade Management
Entry: According to ENTRY label
Stop Loss: According to STOP LOSS label
Take Profit: TP1 → TP2 → TP3
📉 SHORT ENTRY
✅ Entry Conditions
SELL signal appears
SuperTrend turns from green to red
Price < SMA 13
Braid Filter confirms (red)
Trend Panel shows "Bearish" across multiple TFs
📊 Additional Confirmations
MACD Histogram < 0 and declining
RSI crosses below 70 (if reversal signal)
EMA Pullback shows ▼ purple
🎯 Trade Management
Entry: According to ENTRY label
Stop Loss: According to STOP LOSS label
Take Profit: TP1 → TP2 → TP3
🎛️ RECOMMENDED SETTINGS
👥 For Beginners
Sensitivity: 6
Candle Colors: Version 1
Buy/Sell Signals: ON
Reversal Signals: OFF
Trend Panel: ON
🏆 For Experienced Traders
Sensitivity: 4–8 (depending on market)
Reversal Signals: ON
Pullback: ON
All indicators: ON
ATR SL Risk: 1.5–2.0
⚡ For Scalping
Sensitivity: 8–12
Timeframes: 1m, 3m, 5m
Use only: SuperTrend + Braid Filter
Quick TP: Only TP1
📊 For Swing Trading
Sensitivity: 4–6
Timeframes: 1H, 4H, 1D
Use all: Full signals
TP: All 3 levels (TP1, TP2, TP3)
⚠️ IMPORTANT NOTES
🔴 Avoid Trading When
Signals conflict across timeframes
Market is strongly ranging/sideways
Abnormally low volume
Price is at major support/resistance zones
🟢 Prefer Trading When
At least 2–3 confirmations align
Clear trend across multiple timeframes
Strong volume surge
Breakout from consolidation zone
💡 Usage Tips
Always wait for confirmation: Never enter with just 1 signal
Risk management: Place SL according to STOP LOSS label
Follow trend panel: Prioritize overall trend
Use multiple timeframes: Analyze top-down
Backtest first: Test strategy on historical data
🛠️ TROUBLESHOOTING
❓ No signals appear
Check if inputs are enabled
Adjust sensitivity
Try switching timeframe
❓ Too many false signals
Lower sensitivity
Increase Braid Filter strength
Trade only with main trend
❓ Trend panel not showing
Enable "Display Dashboard"
Select proper panel position
Adjust panel size
📞 SUPPORT
If you encounter issues using this script, please:
Carefully read this guide
Practice on a demo account
Backtest thoroughly before live trading
📈 Wishing you successful trading! 🚀
Açık kaynak kodlu komut dosyası
Gerçek TradingView ruhuna uygun olarak, bu komut dosyasının oluşturucusu bunu açık kaynaklı hale getirmiştir, böylece yatırımcılar betiğin işlevselliğini inceleyip doğrulayabilir. Yazara saygı! Ücretsiz olarak kullanabilirsiniz, ancak kodu yeniden yayınlamanın Site Kurallarımıza tabi olduğunu unutmayın.
Feragatname
Bilgiler ve yayınlar, TradingView tarafından sağlanan veya onaylanan finansal, yatırım, işlem veya diğer türden tavsiye veya tavsiyeler anlamına gelmez ve teşkil etmez. Kullanım Şartları'nda daha fazlasını okuyun.