PROTECTED SOURCE SCRIPT
Güncellendi L.I.F.T. - Legaci Index Flow Tracker
L.I.F.T. - Legaci Index Flow Tracker
The 'Legaci Index Flow Tracker' is a cutting-edge tool designed for traders and analysts who want to gain unparalleled insight into the strength and momentum of key market indices. This innovative indicator evaluates the relationship between 13 customisable indices and their respective Simple Moving Averages (SMAs), along with the slopes of those SMAs, to deliver a comprehensive market sentiment analysis.
Key Features:
Why use the "L.I.F.T."?
This indicator is perfect for traders seeking a big-picture overview of market flow across multiple indices while maintaining the flexibility to drill down into specific trends. By tracking price action, SMA relationships, and momentum slopes in a unified framework, the Legaci Index Flow Tracker helps you:
Whether you’re a day trader or a long-term strategist, the indicator is an essential addition to your toolkit, providing you with the clarity and precision needed to navigate today’s complex markets.
The 'Legaci Index Flow Tracker' is a cutting-edge tool designed for traders and analysts who want to gain unparalleled insight into the strength and momentum of key market indices. This innovative indicator evaluates the relationship between 13 customisable indices and their respective Simple Moving Averages (SMAs), along with the slopes of those SMAs, to deliver a comprehensive market sentiment analysis.
Key Features:
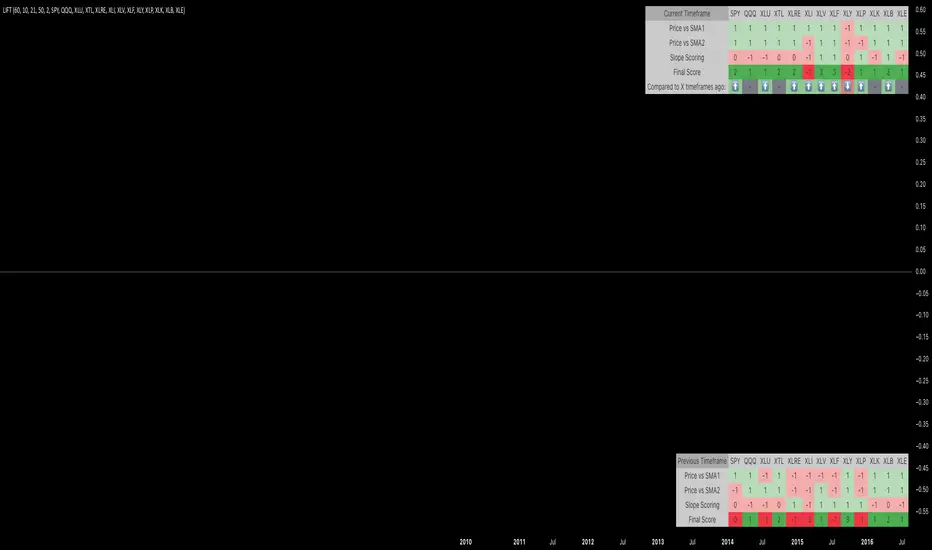
- Dynamic Scoring System:
Each index is evaluated across four categories, assigning a score of +1 (bullish) or -1 (bearish) based on price action and momentum. - Intuitive Table Display:
Scores for each index are presented in an easy-to-read table, highlighting:
The index ticker.
Individual scores for the 4 categories (price vs. SMA and slope).
A Final Score summarising the overall strength or weakness of each index. - Customisable Parameters:
- Timeframe: Adapt to short-term, mid-term, or long-term trading strategies.
- Lookback Period: Fine-tune slope calculations to capture precise market trends.
- SMA Lengths: Adjust the moving average lengths to align with your trading methodology.
- Index Selection: Choose from the 13 default indices or customise them to track your preferred market segments.
- Timeframe: Adapt to short-term, mid-term, or long-term trading strategies.
Why use the "L.I.F.T."?
This indicator is perfect for traders seeking a big-picture overview of market flow across multiple indices while maintaining the flexibility to drill down into specific trends. By tracking price action, SMA relationships, and momentum slopes in a unified framework, the Legaci Index Flow Tracker helps you:
- Identify market trends at a glance.
- Pinpoint the strongest and weakest indices in any timeframe.
- Stay ahead of market shifts with actionable insights.
Whether you’re a day trader or a long-term strategist, the indicator is an essential addition to your toolkit, providing you with the clarity and precision needed to navigate today’s complex markets.
Sürüm Notları
- new version - added a comparison table to see all data for the timeframe X ago (remember the input!)
So for example if you want to compare this weeks data to last weeks data, you would select the weekly timeframe and enter in the "Compare to x timeframes ago:" a '2'
you can enable / disagree that comparison table as you please
Also a new row in the first table has been added with arrow symbols and color coding to showcase the change directly visually compared to 1 timeframe ago
Korumalı komut dosyası
Bu komut dosyası kapalı kaynak olarak yayınlanmaktadır. Ancak, ücretsiz ve herhangi bir sınırlama olmaksızın kullanabilirsiniz – daha fazla bilgiyi buradan edinebilirsiniz.
Feragatname
Bilgiler ve yayınlar, TradingView tarafından sağlanan veya onaylanan finansal, yatırım, alım satım veya diğer türden tavsiye veya öneriler anlamına gelmez ve teşkil etmez. Kullanım Koşulları bölümünde daha fazlasını okuyun.