PROTECTED SOURCE SCRIPT
Web3 Sector Monitor[SurgeGuru]
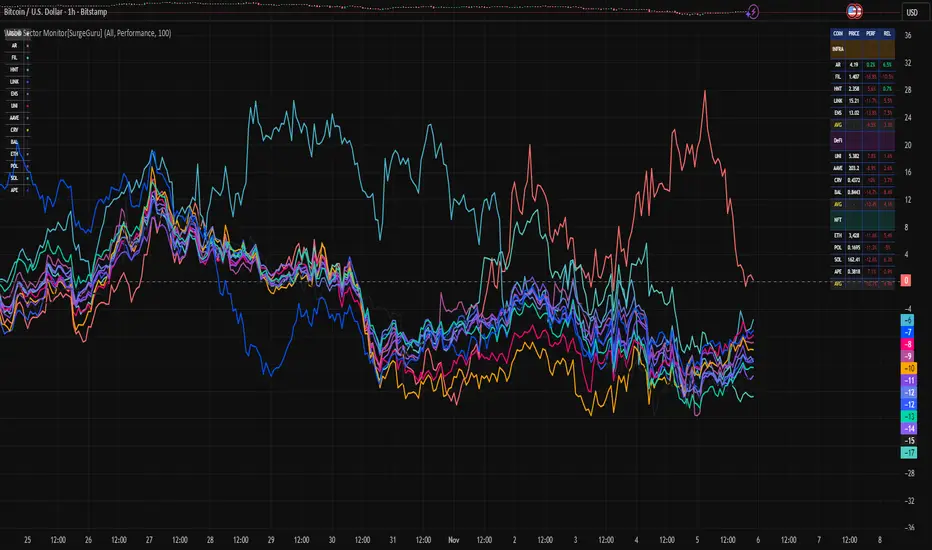
📊 Crypto Sector Monitor — Multi-Sector Strength Dashboard
This script provides a visual and data-driven overview of the performance of major cryptocurrencies, grouped by sector — such as Infrastructure, DeFi, NFTs, and ENS — allowing traders to track which sectors are leading or lagging the market in real time.
🧠 Core Functionality
Sector-Based Grouping:
Coins are organized into distinct categories (Infrastructure, DeFi, NFT, ENS), making it easy to monitor capital flow between ecosystem themes.
Dynamic Performance Analysis:
Calculates percentage change of each coin relative to its value performance_length bars ago (default: 24h).
This gives an immediate view of short-term sector strength or weakness.
Relative Strength Mode:
Compares each asset’s performance against a reference symbol (e.g. BTC or ETH) to display outperformance or underperformance relative to the broader market.
Average Sector Strength:
Displays the average performance per sector, helping identify which category dominates momentum.
Multiple Plot Modes:
Choose between:
📈 Performance: Sector-based color plots showing % change over time.
💰 Price: Real-time price levels of selected coins.
⚖️ Relative Strength: Comparison vs benchmark coin.
🧩 Display & Customization
Compact Table Display:
All results are presented in a color-coded table for quick scanning. Colors correspond to sectors, and optional emojis provide intuitive visual cues.
Configurable Visibility:
Toggle specific categories (Infrastructure, DeFi, NFT, ENS) on/off individually.
Legend Table:
Automatically generated legend explains color mapping and sector composition for clarity.
Dense Mode Option:
Reduces spacing between rows for tighter, minimal layout when screen space is limited.
⚙️ Main Inputs
Performance Length: Lookback period for performance calculation.
Reference Symbol: Used for relative strength comparison.
Plot Mode: Switch between “Performance,” “Price,” and “Relative Strength.”
Dense Mode: Compact visual layout toggle.
📈 Usage
Ideal for crypto traders who want to track sector rotation and relative performance across key crypto ecosystems.
Helps quickly identify which sectors are gaining momentum, potentially signaling where liquidity is flowing next.
🧭 How to Read the Crypto Sector Monitor
The indicator displays a multi-sector dashboard that tracks the short-term performance and relative behavior of key crypto assets.
Each coin is color-coded by sector and shown in a table or chart-style layout depending on the selected mode.
🔹 1. Performance Mode ("Perf")
What it shows:
Each coin’s percentage change over the last X bars (default = 24 hours).
The table displays positive values in greenish tones (strong performance) and negatives in reddish tones (weak performance).
How to read:
Higher positive values → coin is gaining strength vs its past 24h value.
Lower or negative values → coin is losing strength or being sold off.
The sector average row gives an instant snapshot of which group (e.g., Infrastructure, DeFi, NFT) is leading or lagging.
Use case:
Great for detecting sector rotation — when money flows from one theme to another.
Example: If Infrastructure average = +3.5% while DeFi = −1.2%, traders are rotating toward infrastructure assets.
🔹 2. Price Mode ("Price")
What it shows:
The current live price of each tracked coin, updating per bar.
This mode is meant for quick absolute value comparison, not relative changes.
How to read:
Watch how price levels evolve alongside performance.
Combined with the legend, you can see at a glance which assets are higher-value vs low-cap within the same sector.
Use case:
Helpful if you want to anchor context (actual price) while scanning sector behavior.
🔹 3. Relative Strength Mode ("RS")
What it shows:
Each coin’s relative performance vs a chosen benchmark (usually BTC or ETH).
It measures how much the coin outperformed or underperformed compared to the reference symbol.
How to read:
Positive RS → coin is stronger than BTC over the lookback period.
Negative RS → coin is weaker than BTC.
Sector averages reveal whether an entire category is outperforming or lagging the benchmark.
Use case:
Ideal for rotation traders looking for coins that consistently outperform BTC or ETH, indicating alpha potential.
🧩 General Visual Cues
Colors = Sector identity
Each category (Infrastructure, DeFi, NFT, ENS) has its own color palette, reflected across both table and legend.
Legend Table
Appears in the corner with symbols and colors for quick sector identification.
🧠 TL;DR for Traders
Mode - Meaning - What to Look For
Perf % change vs past X bars Strong/weak performers & sector averages
Price Current live price Quick price reference by sector
RS Relative to BTC/ETH Outperformers & underperformers vs benchmark
Korumalı komut dosyası
Bu komut dosyası kapalı kaynak olarak yayınlanmaktadır. Ancak, ücretsiz ve herhangi bir sınırlama olmaksızın kullanabilirsiniz – daha fazla bilgiyi buradan edinebilirsiniz.
Feragatname
Bilgiler ve yayınlar, TradingView tarafından sağlanan veya onaylanan finansal, yatırım, alım satım veya diğer türden tavsiye veya öneriler anlamına gelmez ve teşkil etmez. Kullanım Koşulları bölümünde daha fazlasını okuyun.