OPEN-SOURCE SCRIPT
Güncellendi Crossover EMMM
Crossover EMMM is an indicator that displays the Madrid Moving Averages (EMMM) and detects crossovers (upward crossings) and crossunders (downward crossings) between two moving averages. It uses two input parameters to define the fast and slow EMMM lengths. The script calculates the EMMM values, their changes, and assigns colors based on the change direction. The fast EMMM is plotted in green or red, and the slow EMMM is plotted in blue or red, depending on the change direction. The script also displays triangle shapes below or above the bars to indicate crossovers and crossunders.
The "Madrid Moving Average" (EMMMM) is a type of moving average used in technical analysis to smooth price fluctuations of financial assets, such as stocks or currency pairs. Unlike the Simple Moving Average (SMA), which treats all data equally, the EMMM gives more weight to recent data. This results in the EMMM responding more swiftly to price changes, making it well-suited for identifying short-term trends.
The "Madrid Moving Average" (EMMMM) is a type of moving average used in technical analysis to smooth price fluctuations of financial assets, such as stocks or currency pairs. Unlike the Simple Moving Average (SMA), which treats all data equally, the EMMM gives more weight to recent data. This results in the EMMM responding more swiftly to price changes, making it well-suited for identifying short-term trends.
Sürüm Notları
Crossover EMMM is an indicator that displays the Madrid Moving Averages (EMMM) and detects crossovers (upward crossings)
and crossunders (downward crossings) between two moving averages.
It uses two input parameters to define the fast and slow EMMM lengths.
The script calculates the EMMM values, their changes, and assigns colors based on the change direction.
The fast EMMM is plotted in green or red, and the slow EMMM is plotted in blue or red, depending on the change direction.
The script also displays triangle shapes below or above the bars to indicate crossovers and crossunders.
It also displays small triangles each time the two EMMMs returns in the same trend.
Sürüm Notları
Crossover EMMM is an indicator that displays the Madrid Moving Averages (EMMM) and detects crossovers (upward crossings) and crossunders (downward crossings) between two moving averages.It uses two input parameters to define the fast and slow EMMM lengths.
The script calculates the EMMM values, their changes, and assigns colors based on the change direction.
The fast EMMM is plotted in green or red, and the slow EMMM is plotted in blue or red, depending on the change direction.
The script also displays triangle shapes below or above the bars to indicate crossovers and crossunders.
Sürüm Notları
Crossover EMMM is an indicator that displays the Madrid Moving Averages (EMMM) and detects crossovers (upward crossings)and crossunders (downward crossings) between two moving averages.
It uses two input parameters to define the fast and slow EMMM lengths.
The script calculates the EMMM values, their changes, and assigns colors based on the change direction.
The fast EMMM is plotted in green or red, and the slow EMMM is plotted in blue or red, depending on the change direction.
The script also displays triangle shapes below or above the bars to indicate crossovers and crossunders.
It also displays little circles when the two Movign averages come back to the same color.
Updated 10.29.2023 : Offset option added.
Circles shapes replace little triangle shapes.
Sürüm Notları
Crossover EMMM is an indicator that displays the Madrid Moving Averages (EMMM) and detects crossovers (upward crossings)
and crossunders (downward crossings) between two moving averages.
It uses two input parameters to define the fast and slow EMMM lengths.
The script calculates the EMMM values, their changes, and assigns colors based on the change direction.
The fast EMMM is plotted in green or red, and the slow EMMM is plotted in blue or red, depending on the change direction.
The script also displays triangle shapes below or above the bars to indicate crossovers and crossunders.
It also displays little circles when the two Movign averages come back to the same color.
Updated 10.29.2023
Offset option added,
Circles shapes replace little triangles default shapes.
EMMM Plot shape line replaces stepline default shape.
Sürüm Notları
Crossover EMMM is an indicator that displays the Madrid Moving Averages (EMMM) and detects crossovers (upward crossings)and crossunders (downward crossings) between two moving averages.
It uses two input parameters to define the fast and slow EMMM lengths.
The script calculates the EMMM values, their changes, and assigns colors based on the change direction.
The fast EMMM is plotted in green or red, and the slow EMMM is plotted in blue or red, depending on the change direction.
The script also displays triangle shapes below or above the bars to indicate crossovers and crossunders.
It also displays little circles when the two Moving averages come back to the same color.
Updated 10.29.2023
Offset option added,
Circles shapes replace little triangles default shapes.
EMMM Plot shape line replaces stepline default shape.
Triangles and circles are sync with the crossovers and colors.
Sürüm Notları
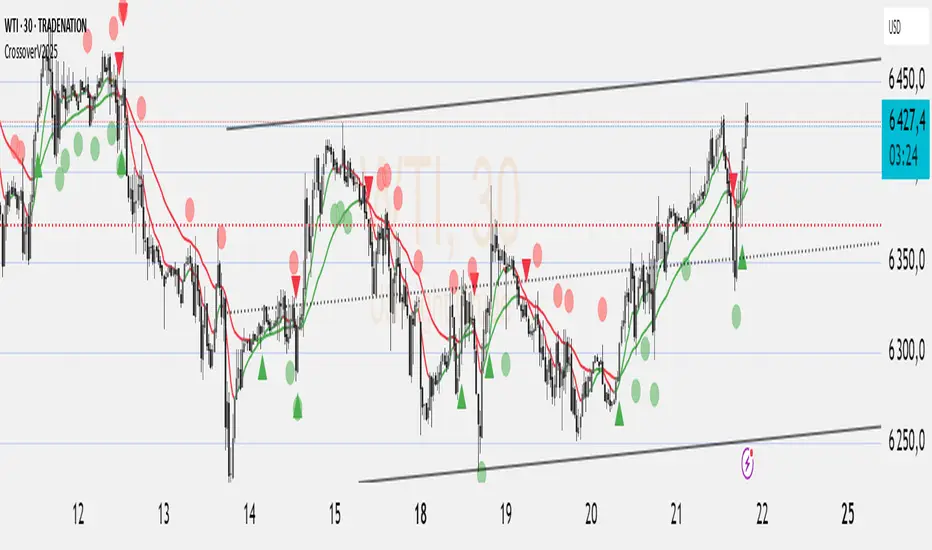
CrossoverV2025 is based on the Madrid Moving Averages (EMMM) and helps identify trend reversals across any market — forex, stocks, crypto, and more.🔹 The indicator displays two dynamic moving averages (fast and slow) that change color based on their direction:
Green = upward momentum (bullish)
Red = downward momentum (bearish)
🟢 Green triangle below the price = Buy signal ("BUY EMM")
🔴 Red triangle above the price = Sell signal ("SELL EMM")
🟡 Red circle above the bar = confirmed bearish reversal → "Point Sell"
🟢 Green circle below the bar = confirmed bullish reversal → "Point Buy"
🔔 Automatic Alerts:
"BUY EMM" / "SELL EMM" triggered on every crossover/crossunder
"Point Buy" / "Point Sell" when both moving averages turn green or red together after a trend change
💡 How to use:
Ideal for spotting early trend reversals. For best results, combine with other tools like RSI, support/resistance levels, or volume analysis to filter signals.
Sürüm Notları
CrossoverV2025 is based on the Madrid Moving Averages (EMMM) and helps identify trend reversals across any market — forex, stocks, crypto, and more.🔹 The indicator displays two dynamic moving averages (fast and slow) that change color based on their direction:
Green = upward momentum (bullish)
Red = downward momentum (bearish)
🟢 Green triangle below the price = Buy signal ("BUY EMM")
🔴 Red triangle above the price = Sell signal ("SELL EMM")
🟡 Red circle above the bar = confirmed bearish reversal → "Point Sell"
🟢 Green circle below the bar = confirmed bullish reversal → "Point Buy"
🔔 Automatic Alerts:
"BUY EMM" / "SELL EMM" triggered on every crossover/crossunder
"Point Buy" / "Point Sell" when both moving averages turn green or red together after a trend change
💡 How to use:
Ideal for spotting early trend reversals. For best results, combine with other tools like RSI, support/resistance levels, or volume analysis to filter signals.
Açık kaynak kodlu komut dosyası
Gerçek TradingView ruhuyla, bu komut dosyasının mimarı, yatırımcıların işlevselliğini inceleyip doğrulayabilmesi için onu açık kaynaklı hale getirdi. Yazarı tebrik ederiz! Ücretsiz olarak kullanabilseniz de, kodu yeniden yayınlamanın Topluluk Kurallarımıza tabi olduğunu unutmayın.
Feragatname
Bilgiler ve yayınlar, TradingView tarafından sağlanan veya onaylanan finansal, yatırım, alım satım veya diğer türden tavsiye veya öneriler anlamına gelmez ve teşkil etmez. Kullanım Koşulları bölümünde daha fazlasını okuyun.