OPEN-SOURCE SCRIPT
Güncellendi Volume Pressure Analysis

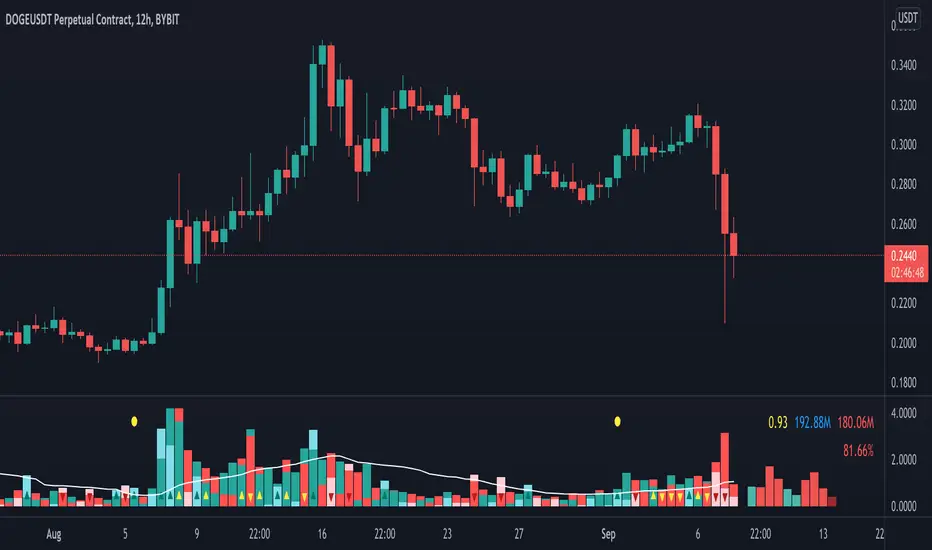
Volume Pressure Analysis is a new concept I have been working on designed to show the effort required to move price. An ideal tool for confirming trends or locating reversals early. This indicator can highlight whale action and market manipulation. It calculates volume vs volatility and displays the results as a meter:
Above 0 shows how easy price action is traveling, the bigger these bars the less volume and effort is required to push price. These are indicated with a teal or red arrows and can confirm the beginning or continuation of a trend. This is the natural direction the chart wants to travel at that time.
Below 0 shows how hard price is to move. The bigger these bars the more volume and effort is required to push price. When whales and market makers push price against its will these bars will get bigger.
Yellow arrows signal pressure in that direction and excessive amounts of volume is required to move price. These signals can lead to reversal/ pivot points as price action struggles to continue its trend. These signals can be turned on in settings or use the overlay version of this script to display signals on chart. This is a very powerful tool when used with relative volume.
Sürüm Notları
This update includes 2 new themes:RVOL Analysis: Shows support and resistance flow over relative volume bars
RVOL: Shows only the resistance flow and highlights anomalies. This is great to get an idea of buy/sell pressure for each candle.
Sürüm Notları
Updated RVOL theme and made it default.Now shows live pressure information on current bar and highlights past pressure anomalies.
Sürüm Notları
This update includes 5 Themes and 3 widget options. I updated all the original themes to function and look better. I maxed out on this script so no room for future additions. In the future I will be using widgets in my scripts to utilize extra space avail on right of indicators. RVOL Analysis is now default theme.THEMES:
Pressure Analysis: Shows support and resistance of price action. Teal color signals Support and positive pressure going with the direction of the candle. Red shows resistance pressure. Teal and Red represent support and resistance, not buy and sell.
Support Vs Resistance: This is the pressure analysis but with no minus scale. Teal = Support / Red = Resistance. ( If chart candle is red and S and R bar is teal it means that the price wants to travel down.
Directional Pressure: Show the direction of the pressure. Teal = Buy pressure, Red = Sell pressure
RVOL Analysis: RVOL analysis Shows all pressure data agains RVOL
RVOL: Cleaner version of RVOL Analysis.
WIDGETS:
Support Vs Resistance: Shows last 10 bars of S and R theme
Directional Pressure: Shows last 10 bars of Directional Pressure theme
Support Vs Resistance + Directional Pressure: Shows both widgets.
EXTRAS:
Relative Volatility: Can display on RVOL Analysis them or on widget.
Directional Pressure Percentage %: Shows percentage of directional pressure for last 10(customizable) bars. Displayed under volume total. Teal = buy pressure, Red = sell pressure
Widgets below:
Support and resistance widget below:
With Relative Volatility (yellow)
Themes:
Açık kaynak kodlu komut dosyası
Gerçek TradingView ruhuyla, bu komut dosyasının mimarı, yatırımcıların işlevselliğini inceleyip doğrulayabilmesi için onu açık kaynaklı hale getirdi. Yazarı tebrik ederiz! Ücretsiz olarak kullanabilseniz de, kodu yeniden yayınlamanın Topluluk Kurallarımıza tabi olduğunu unutmayın.
Feragatname
Bilgiler ve yayınlar, TradingView tarafından sağlanan veya onaylanan finansal, yatırım, alım satım veya diğer türden tavsiye veya öneriler anlamına gelmez ve teşkil etmez. Kullanım Koşulları bölümünde daha fazlasını okuyun.